
|
Related Topics
|
|
Category: Amazon (AMZN) and Technical Analysis
Date: 21 July 2020 Stock price of Amazon: $3196.84 Ever wondered where the support and resistance levels for Amazon (AMZN) stock is? Is it a good time to buy or is there a dip in its future? We take a look at potential support and resistance levels of Amazon (AMZN).
|
|
So should AMZN stock pull back the first support level will be at $3081.94, its 10 day moving average, after which its 30 day moving average should be seen as the next support level."
More About Amazon (AMZN)
Amazon is guided by four principles: customer obsession rather than competitor focus, passion for invention, commitment to operational excellence, and long-term thinking. Customer reviews, 1-Click shopping, personalized recommendations, Prime, Fulfillment by Amazon, AWS, Kindle Direct Publishing, Kindle, Fire tablets, Fire TV, Amazon Echo, and Alexa are some of the products and services pioneered by Amazon.
Quick facts of Amazon (AMZN)
Quick facts of Amazon (AMZN)
- Net sales of Amazon in 2019: $280.522 billion
- Total value of Amazon's assets: $225.248 billion
- Cash and equivalents of Amazon: $10.4 billion
- Cash provided by operating activities during 2019: $38.514 billion
- Amazon marketing expenses amounted to $13.814 billion in 2019
- Amazon's technology and content development costs in 2019 were: $28.837 billion
- As at end of December 2019, Amazon employed 798 000 full time employees
- Seasonal fluctuations of Amazon. The 4th quarter Amazon sees the highest sales with it having contributed (34%, 31% and 31% of total sales for the 2017, 2018 and 2019 fiscal years)
- As a 22 January 2020, the group has 3 192 shareholders of their common stock

Amazon scout
Technical analysis of Amazon (AMZN) stock
While there are many different technical analysis indicators we tend to follow the principle of keeping things simple. The KIS principle. So we will take a look at the shorter term moving averages and the longer term moving averages as well as the True Strength Index (TSI). So let's focus at the longer term moving averages first. The image below shows the stock price of AMZN as well as its 50 day and 200 day moving average as well as the TSI for Amazon (AMZN)
From the image shows the TSI base and TSI signal values are very close to one another. If the signal value crosses below the base value it is sign that a stock is due for a correction. At this point the signal value is still above the base value but as both has turned downwards recent we believe there is some weakness to come for Amazon stock.
Turning our attention to the moving averages one can see the 50 day moving average is well above the 200 day moving average (which is a positive sign for a company's stock price). If the 50 day moving average crosses below the 200 day moving average it is a negative sign and indicates potential stock declines. From the image above one can see the 50 day moving average is far away from the 200 day moving average. But since the TSI is pointing to a potential decline in the stock of AMZN the question is how far will it fall, if it falls? The 50 day moving average and 200 day moving average also shows medium and long term support levels for a stock price. So should AMZN stock decline it will find medium and longer term support at the following prices:
- 50 day moving average: $2666.77
- 200 day moving average : $2108.44
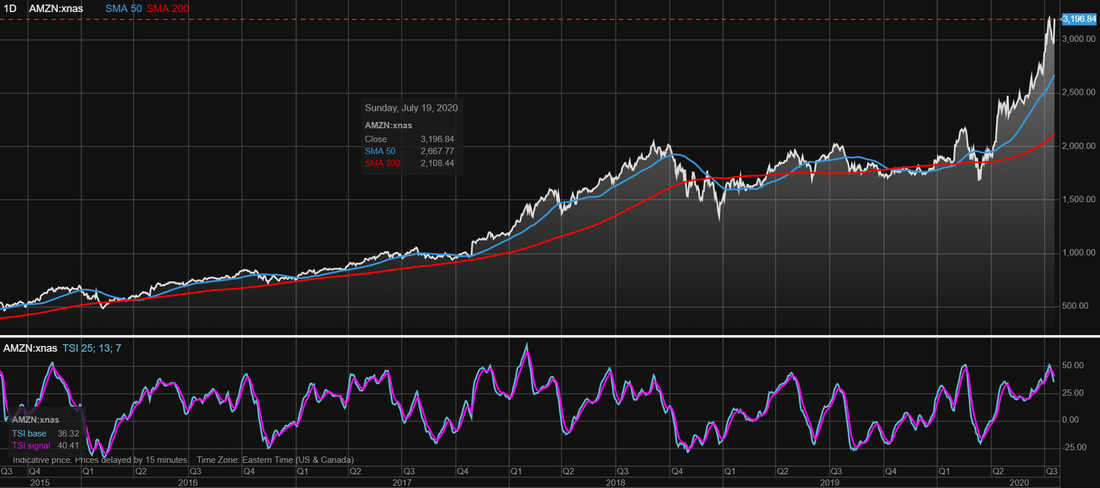
Amazon (AMZN) stock price history with 50 day and 200 day moving average
The image below is similar to the above expect the moving averages are a lot shorter, however they are interpreted in exactly the same way as the longer term moving averages. Right now the 10 day moving average is well above the 30 day moving average, but the 10 day moving average is slowing and starting to turn negative. So let's take a look at the support levels provided by the 10 and 30 day moving average.
So should AMZN stock pull back the first support level will be at $3081.94, its 10 day moving average, after which its 30 day moving average should be seen as the next support level.
- 10 day moving average: $3081.94
- 30 day moving average : $2825.93
So should AMZN stock pull back the first support level will be at $3081.94, its 10 day moving average, after which its 30 day moving average should be seen as the next support level.
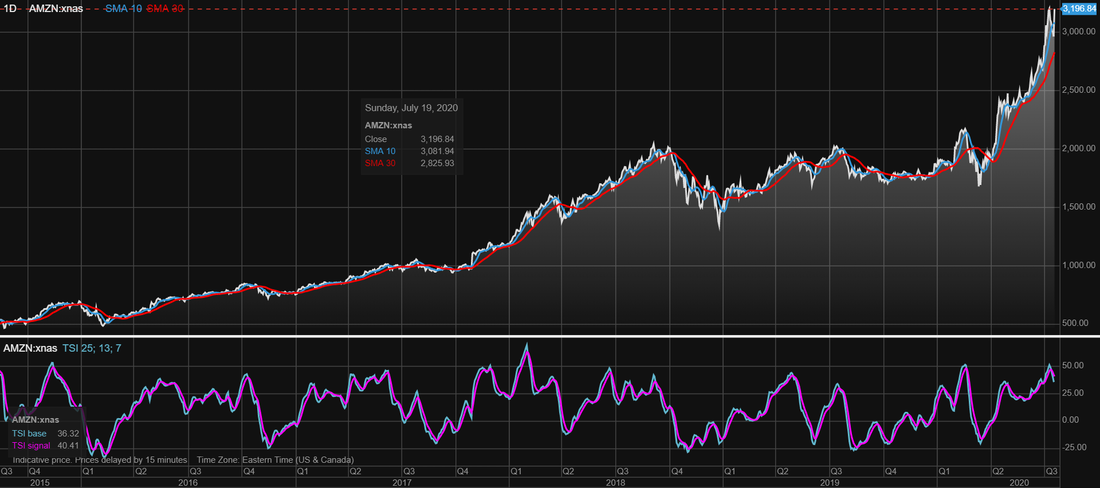
Amazon (AMZN) stock price history with 10 day and 30 day moving average
Support and resistance levels for Amazon (AMZN) stock based on pivot points
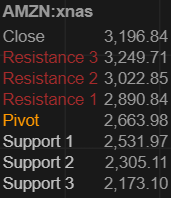
Lastly we take a look at the support and resistance levels of Amazon (AMZN) based on pivot points. Pivot points are calculated by taking the average of the high, low and closing price over a particular period selected (in this case a month)
Support and resistance levels for Amazon (AMZN) stock based on pivot points
Below a summary of the resistance levels, pivot point and the different support levels:
So should the stock of Amazon hits $2890.84 it might struggle to get past that level and if it does its next resistance levels will be at $3022.85. However should the stock of Amazon t decline and get to the pivot value of $2666.98 and drop below it it will most likely find support at $2531.97 and if it falls below that the next support line level is at $2305.11
- Resistance 3: $3249.71
- Resistance 2: $3022.85
- Resistance 1: $2890.84
- Pivot Point: $2666.98
- Support 1: $2531.97
- Support 2: $2305.11
- Support 3: $2173.10
So should the stock of Amazon hits $2890.84 it might struggle to get past that level and if it does its next resistance levels will be at $3022.85. However should the stock of Amazon t decline and get to the pivot value of $2666.98 and drop below it it will most likely find support at $2531.97 and if it falls below that the next support line level is at $2305.11