
|
Related Topics
|
|
Category: Amazon (AMZN) and Technical Analysis
Date: 14 July 2020 Stock Price of Amazon: $3104.00 The stock price of Amazon (AMZN) has increased by 492.4% over the last 5 years. A very handsome return provided to stockholders. The question is what is next for Amazon (AMZN) stock? Where is it heading over the short and longer term?
|
|
While over the 5 year period the stock of Amazon (AMZN) increased by a very strong 492.4%. No stockholder will ever say no to these types of returns. But the question is where to from here for the stock of Amazon (AMZN)? Below we do some technical analysis on Amazon's stock price in order to determine the most likely route AMZN stock is to take in coming weeks and months."
More About Amazon (AMZN)
Amazon is guided by four principles: customer obsession rather than competitor focus, passion for invention, commitment to operational excellence, and long-term thinking. Customer reviews, 1-Click shopping, personalized recommendations, Prime, Fulfillment by Amazon, AWS, Kindle Direct Publishing, Kindle, Fire tablets, Fire TV, Amazon Echo, and Alexa are some of the products and services pioneered by Amazon.
Quick facts of Amazon
Quick facts of Amazon
- Net sales of Amazon in 2019: $280.522 billion
- Total value of Amazon's assets: $225.248 billion
- Cash and equivalents of Amazon: $10.4 billion
- Cash provided by operating activities during 2019: $38.514 billion
- Amazon marketing expenses amounted to $13.814 billion in 2019
- Amazon's technology and content development costs in 2019 were: $28.837 billion
- As at end of December 2019, Amazon employed 798 000 full time employees
- Seasonal fluctuations of Amazon. The 4th quarter Amazon sees the highest sales with it having contributed (34%, 31% and 31% of total sales for the 2017, 2018 and 2019 fiscal years)
- As a 22 January 2020, the group has 3 192 shareholders of their common stock

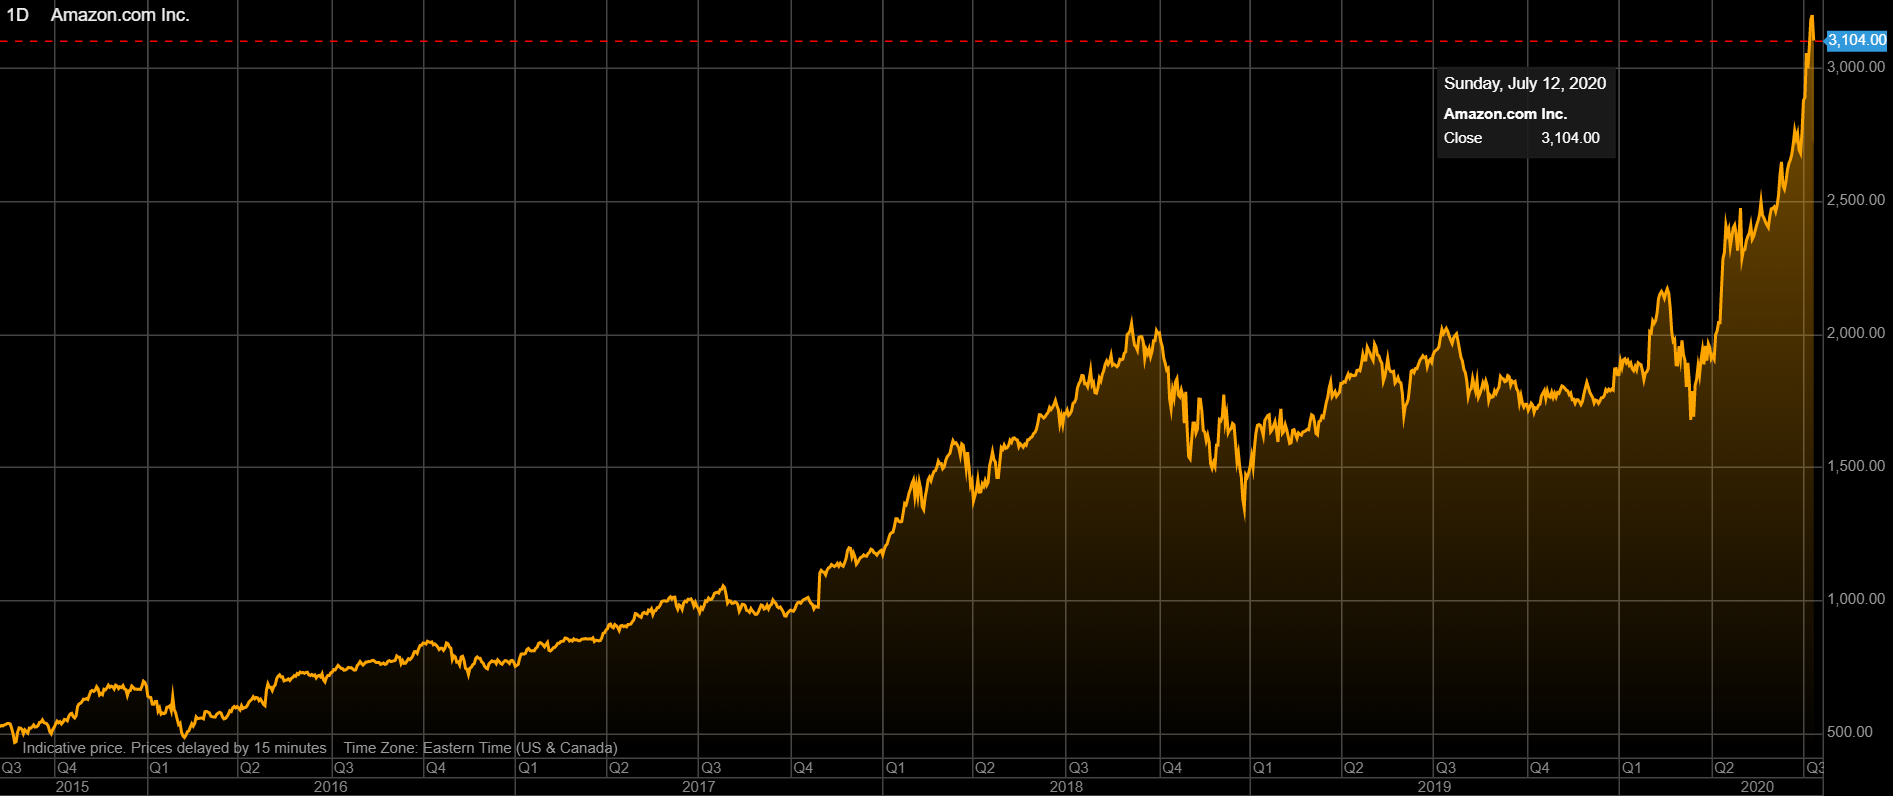
Amazon (AMZN) stock price history over the last 5 years
The image below shows the stock price history of Amazon (AMZN) over the last 5 years. And its been a very very good time for Amazon (AMZN) stockholders with the stock of Amazon increasing by 492.4% over the last 5 years
Amazon (AMZN) stock price history over the last 5 years
While over the 5 year period the stock of Amazon (AMZN) increased by a very strong 492.4%. No stockholder will ever say no to these types of returns. But the question is where to from here for the stock of Amazon (AMZN)? Below we do some technical analysis on Amazon's stock price in order to determine the most likely route AMZN stock is to take in coming weeks and months.
Technical Analysis of Amazon (AMZN) stock price
While there are many different technical analysis indicators we tend to follow the principle of keeping things simple. The KIS principle. So we will take a look at the shorter term moving averages and the longer term moving averages as well as the Relative Strength Index (RSI). So let's focus at the longer term moving averages first. The image below shows the stock price of AMZN as well as its 50 day and 200 day moving average as well as the RSI for Amazon (AMZN)
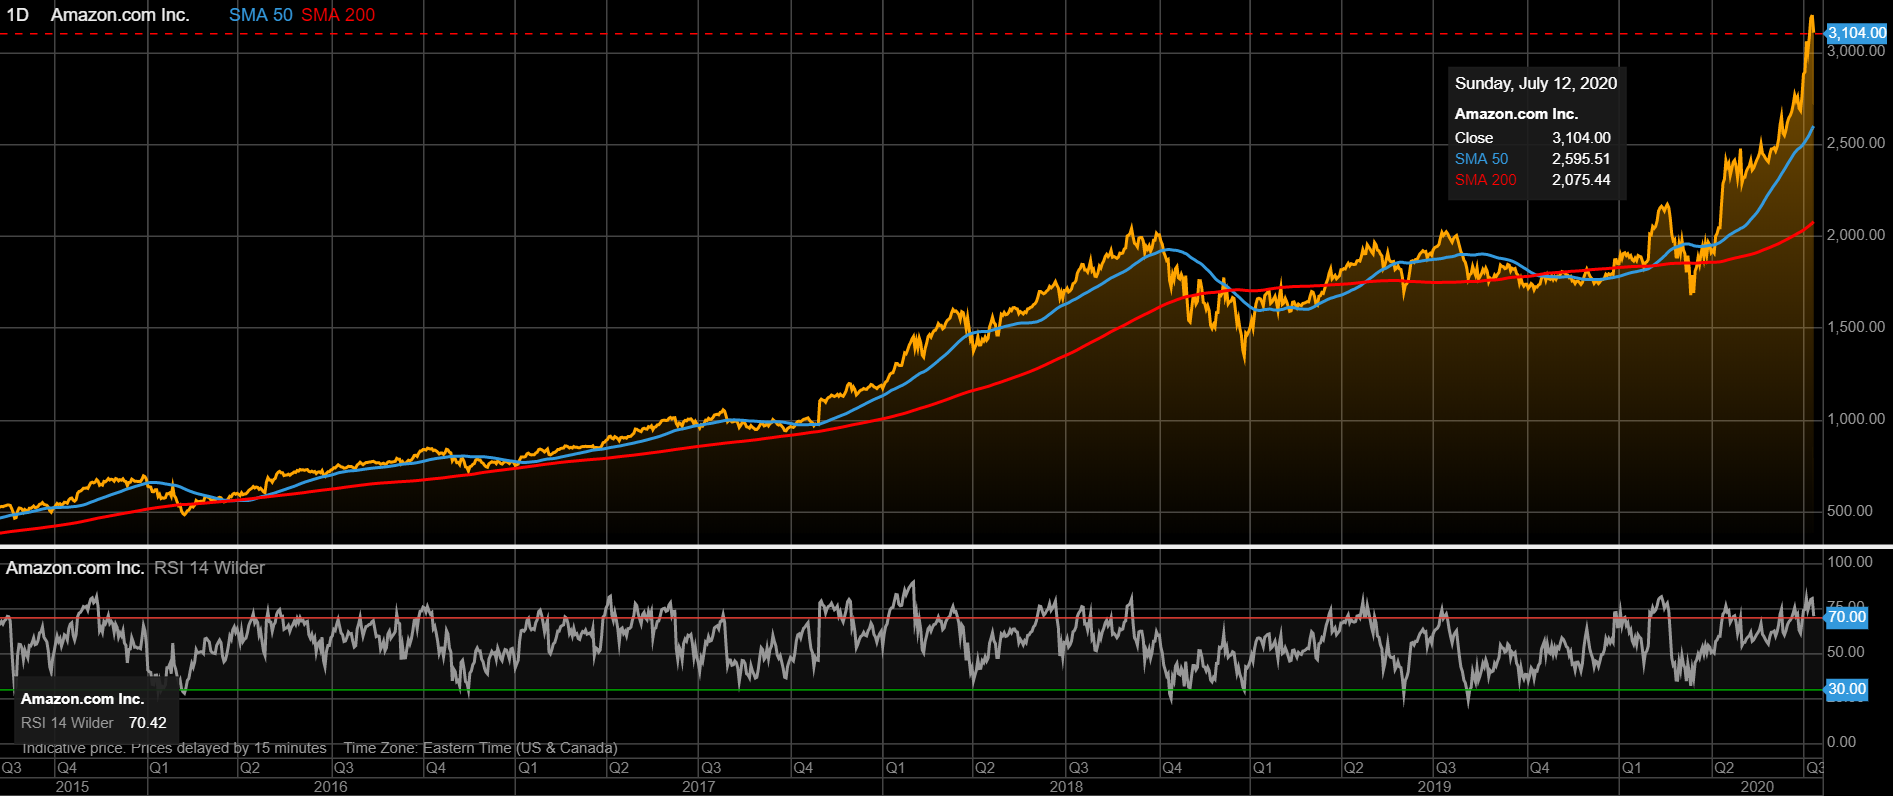
Amazon (AMZN) stock price with its 50 and 200 day moving average and RSI
From the image above, one can see that the RSI is above the 70 line, which is an indicator of a stock being overbought (basically it is due for a correction). Turning our attention to the moving averages one can see the 50 day moving average is well above the 200 day moving average (which is a positive sign for a company's stock price). If the 50 day moving average crosses below the 200 day moving average it is a negative sign and indicates potential stock declines. From the image above one can see the 50 day moving average is far away from the 200 day moving average. But since the RSI is pointing to a potential decline in the stock of AMZN the question is how far will it fall, if it falls? The 50 day moving average and 200 day moving average also shows medium and long term support levels for a stock price. So should AMZN stock decline it will find medium and longer term support at the following prices:
As we mentioned 50 day and 200 day moving averages are longer term technical indicators, so let's take a look at shorter term indicators. The image below shows the stock price of Amazon (AMZN) as well as its 10 day and 30 day moving average as well as the RSI for Amazon (AMZN).
- 50 day moving average: $2595.51
- 200 day moving average : $2075.44
As we mentioned 50 day and 200 day moving averages are longer term technical indicators, so let's take a look at shorter term indicators. The image below shows the stock price of Amazon (AMZN) as well as its 10 day and 30 day moving average as well as the RSI for Amazon (AMZN).

In a similar vein to the approach to the longer term analysis, if the 10 day moving averages crosses over above the 30 day moving average it is a positive sign for a stock and if the 10 day moving average crosses below the 30 day moving average its a negative sign for a stock price. At this point the 10 day moving average is trading at well above the 30 day moving average (a positive sign). But since the RSI is indicating potential declines the question is over the shorter term period where are the support levels for Amazon's stock price?
So should Amazon (AMZN) stock be in for a correction as the RSI indicates, the first support levels will be the shorter term levels shown above. If the stock falls below these support levels the next support levels will be the 50 day and 200 day moving average levels.
Thus if the stock of Amazon decides today to start its decline we will see the following levels as support levels for Amazon (AMZN)
- 10 day moving average: $2983.31
- 30 day moving average: $2729.73
- 50 day moving average: $2595.51
- 200 day moving average : $2075.44