
US average consumer spending increased by 3% from 2018 to 2019
|
Category: Economics and Consumer Spending
Date: 5 October 2020 We take a look at an article published by the Bureau of Labor Statistics (BLS) in which they state that US consumer spending increased by 3% in 2019 when compared to 2018.
|

|
Average consumer expenditures for 2019 were $63,036, a 3.0-percent increase from 2018. During the same period, the Consumer Price Index (CPI-U) rose 1.8 percent, and average pretax incomes increased by 5.4 percent. "
Consumer spending increased 3.0 percent from 2018 to 2019
Average consumer expenditures for 2019 were $63,036, a 3.0-percent increase from 2018. During the same period, the Consumer Price Index (CPI-U) rose 1.8 percent, and average pretax incomes increased by 5.4 percent. From 2018 to 2019, a 10.1-percent increase in transportation spending was the largest percentage increase among all major components. This increase largely resulted from a 58.3-percent increase in vehicle insurance spending, but that was in part due to a change in the data source for vehicle insurance. Average expenditures for vehicle purchases were up 10.5 percent, and average household expenditures for gasoline, other fuels, and motor oil decreased 0.7 percent over the year.
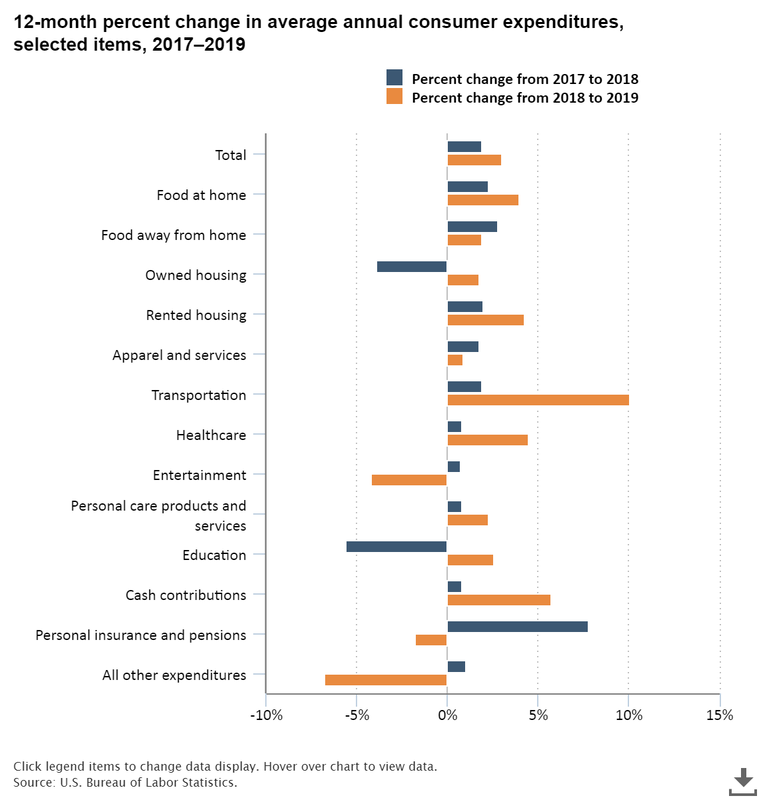
From 2018 to 2019, the only percentage decreases among the largest spending components were a 4.2-percent decrease in entertainment spending and a 1.8-percent decrease in spending on personal insurance and pensions. This compared with increases of 0.7 percent and 7.8 percent, respectively, from 2017 to 2018. Spending on food at home (4.0 percent) and food away from home (1.9 percent) increased from 2018 to 2019. Healthcare spending increased 4.5 percent in 2019, following a modest 0.8-percent increase in 2018. Spending on rented dwellings was up 4.3 percent, while spending on owned dwellings increased 1.8 percent. Education spending was up 2.6 percent in 2019 after a decrease of 5.6 percent in 2018.
Household spending increased for all five income groups, ranging from 1.3 percent for households in the second 20 percent of income to 8.6 percent for households in the lowest 20 percent of income.
Household spending increased for all five income groups, ranging from 1.3 percent for households in the second 20 percent of income to 8.6 percent for households in the lowest 20 percent of income.
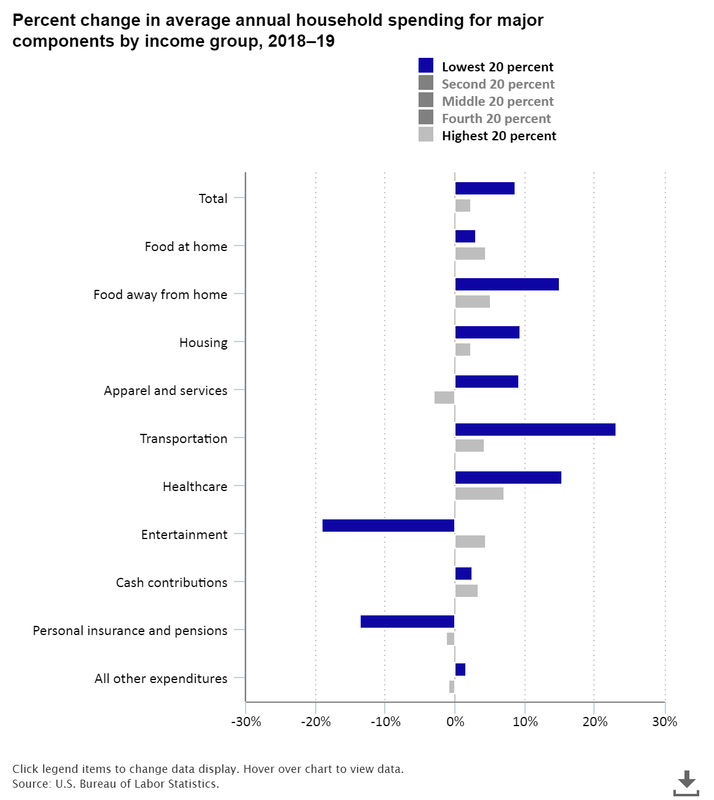
From 2018 to 2019, consumer spending on food at home, housing, transportation, and cash contributions increased for all five income groups. Healthcare spending rose in all income groups except for the second 20 percent. Spending on entertainment, personal insurance and pensions, and all other expenditures decreased in four of five income groups.
These data come from the Consumer Expenditure Surveys. To learn more, see “Consumer Expenditures — 2019.” Consumer units include families, single persons living alone or sharing a household with others but who are financially independent, or two or more persons living together who share expenses.
These data come from the Consumer Expenditure Surveys. To learn more, see “Consumer Expenditures — 2019.” Consumer units include families, single persons living alone or sharing a household with others but who are financially independent, or two or more persons living together who share expenses.
Our commentary on this article
The strong increase in the percentage change of household spending on transport largely due to a change in source data raises questions and concerns regarding the method and source of data. Below an extract provided by the BLS on the matter.
To users of the 2019 Consumer Expenditure Surveys Annual Calendar Year estimates:
For expenditures collected in both surveys, the CE program uses a statistical method to select the source used in publication. In 2019, while vehicle insurance spending showed a sizable year-over-year increase of 58.3 percent, it is important to note that the 2018 estimate was sourced from the Diary Survey and the 2019 estimate was sourced from the Interview Survey. As noted, this source change was due to the determination of a better measurement of vehicle insurance spending in the Interview Survey in 2019. For comparison, the year-over-year change for the Diary Survey estimate was -15.1 percent; and the year-over-year change for the Interview Survey estimate was 4.0 percent. Had the source for vehicle insurance spending remained the Diary Survey in 2019, the year-over-year change in the estimate of transportation expenditures would have been 2.7 percent, instead of 10.1 percent.
Related Topics