|
Related Topics
|
|
Category: Economics and Inflation
Date: 22 January 2020 In this article we focus on the average energy prices in the west of the United States for areas such as Los Angeles, Long Beach and Anaheim for December 2019. A while ago we mentioned a while ago that inflation in the west has been higher than the rest of USA for a number of years now. Is it due to the energy prices in the west of the USA?
|

Los Angeles skyline. Image obtained from Goalcost.com
|
A brief summary provided on average energy prices as obtained from the BLS
Gasoline prices averaged $3.641 a gallon in the Los Angeles-Long Beach-Anaheim area in December 2019, the U.S. Bureau of Labor Statistics reported today. Assistant Commissioner for Regional Operations Richard Holden noted that area gasoline prices were higher than last December when they averaged $3.410 per gallon. Los Angeles area households paid an average of 19.0 cents per kilowatt hour (kWh) of electricity in December 2019, higher than the 18.4 cents price per kWh paid in December 2018. The average cost of utility (piped) gas at $1.215 per therm in December was lower than the $1.350 per therm spent last year. (Data in this release are not seasonally adjusted; accordingly, over-the-year-analysis is used throughout.)
At $3.641 a gallon, Los Angeles area consumers paid 37.3 percent more than the $2.652 national average in December 2019. A year earlier, consumers in the Los Angeles area paid 37.6 percent more than the national average for a gallon of gasoline. The local price of a gallon of gasoline has ranged from 17.1 to 37.6 percent above the national average in the month of December during the past five years. (See chart below.)
At $3.641 a gallon, Los Angeles area consumers paid 37.3 percent more than the $2.652 national average in December 2019. A year earlier, consumers in the Los Angeles area paid 37.6 percent more than the national average for a gallon of gasoline. The local price of a gallon of gasoline has ranged from 17.1 to 37.6 percent above the national average in the month of December during the past five years. (See chart below.)
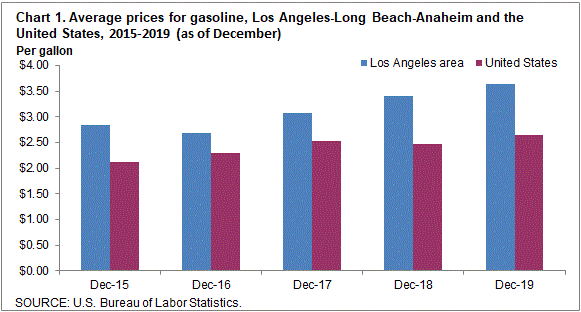
Average gasoline prices in the Los Angeles-Long Beach - Anaheim area for November over the last 5 years
The 19.0 cents per kWh Los Angeles households paid for electricity in December 2019 was 42.9 percent more than the nationwide average of 13.3 cents per kWh. Last December, electricity costs were 36.3 percent higher in Los Angeles compared to the nation. In the past five years, prices paid by Los Angeles area consumers for electricity exceeded the U.S. average by 36.3 percent or more in the month of December.
Prices paid by Los Angeles area consumers for utility (piped) gas, commonly referred to as natural gas, were $1.215 per therm, 14.9 percent more than the national average in December 2019 ($1.057 per therm). A year earlier, area consumers paid 24.4 percent less per therm for natural gas compared to the nation. In the Los Angeles area over the past five years, the per therm cost for natural gas in December has varied between 10.7 percent and 29.3 percent above the U.S. average.
Technical note on the average prices used in this article
Average prices are estimated from Consumer Price Index (CPI) data for selected commodity series to support the research and analytic needs of CPI data users. Average prices for electricity, utility (piped) gas, and gasoline are published monthly for the U.S. city average, the 4 regions, 9 divisions, 2 population size classes, 8 region/size-class cross-classifications, and the 23 largest local index areas. For electricity, average prices per kilowatt-hour (kWh) are published. For utility (piped) gas, average prices per therm, are published. For gasoline, the average price per gallon is published. Average prices for commonly available grades of gasoline are published as well as the average price across all grades.
All eligible prices are converted to a price per normalized quantity. These prices are then used to estimate a price for a defined fixed quantity. The average price per kilowatt-hour represents the total bill divided by the kilowatt-hour usage. The total bill is the sum of all items applicable to all consumers appearing on an electricity bill including, but not limited to, variable rates per kWh, fixed costs, taxes, surcharges, and credits. This calculation also applies to the average price per therm for utility (piped) gas.
The image below shows the year on year inflation rate of various regions within the United States and as it clearly shows the inflation rate of the West of the United States is far higher than any of the other regions in the US and it has been for quiet a while. Basically since the middle of 2013 the inflation rate of the west of the United States has outstripped the inflation rate of the USA

Consumer Price Index by region in the USA. The West of the USA has an inflation rate far greater than the national US average
With energy prices being one of the main drivers of inflation in the USA and the fact that the average price price for gasoline in the west being well above that of the national US average it is no real surprise that the inflation rate experienced by the west of the USA is greater than that of the rest of the USA.