|
Related Topics
|
|
Category: Citigroup (C), JPMorgan (JPM) and Wells Fargo (WFC)
Date: 18 January 2021 Stock price of Citigroup: $64.23 Stock price of JPMorgan: $138.64 Stock price of Wells Fargo: $32.04 In our latest battle of the banks we compare the stock performance and latest quarterly results of Wells Fargo (WFC) JPMorgan Chase (JPM) and Citigroup (C). Which stock is best positioned for future growth and whose stock has been the best performer over the last 5 years?
|

|
All of these firms are active in the banking and financial services sector in the USA. And their stock price trends look very similar, but the stock price returns are however very different. JPMorgan's stock was by far the best performer and Wells Fargo by far the worst performer over the last 5 years "
More About Wells Fargo (WFC)
Wells Fargo & Company (NYSE: WFC) is a leading financial services company that has approximately $1.9 trillion in assets and proudly serves one in three U.S. households and more than 10% of all middle market companies in the U.S. We provide a diversified set of banking, investment and mortgage products and services, as well as consumer and commercial finance, through our four reportable operating segments: Consumer Banking and Lending, Commercial Banking, Corporate and Investment Banking, and Wealth and Investment Management. Wells Fargo ranked No. 30 on Fortune’s 2020 rankings of America’s largest corporations. In the communities we serve, the company focuses its social impact on building a sustainable, inclusive future for all by supporting housing affordability, small business growth, financial health and a lowcarbon economy.
Data below refers to the latest quarterly data unless specified otherwise:
Our latest stock valuation of Wells Fargo: $40.30
Data below refers to the latest quarterly data unless specified otherwise:
- Revenue: $17.925 billion (up from $19.86 billion for the same period of the previous year)
- Revenues decreased by -10% over the last 12 months
- Non interest expenses : $14.8 billion (up from $15.6 billion for the same period of the previous year)
- Non interest expenses decreased by -5% over the last 12 months
- Net income: $2.992 billion (up from $2.873 billion for the same period of the previous year)
- Diluted earnings per share: $0.64 (up from $0.60 for the same period of the previous year)
- PE ratio of Wells Fargo: 12.6
- Diluted weighted-average shares outstanding: 4.15 billion (down from 4.234 billion for the same period of the previous year)
- Book value per share: $397.6 (down from $40.3 for the same period of the previous year)
- Cash and cash equivalents: $28.23 billion
- Cash and cash equivalents per share: $7.04
- Cash and cash equivalents makes up 21.9% of Wells Fargo market capital
- Cash and cash equivalents makes up 1.4% of Wells Fargo total assets
- Cash and cash equivalents per share: $7.04
- Loans net of allowances for losses: $869.1 billion
- Loans net of allowances makes up 49% of Wells Fargo total assets
- Goodwill: $26.4 billion
- Goodwill makes up 1.5% of Wells Fargo total assets
- Goodwill per stock: $6.36
- Stockholders equity in Wells Fargo: $185.9 billion
- Stockholders equity per share: $44.79
- So Wells Fargo is trading a 0.72 times its stockholders equity which is well outside the expected range of between 2 and 6 which most firms tend to trade at.
Our latest stock valuation of Wells Fargo: $40.30
More About JPMorgan Chase (JPM)
JPMorgan Chase (NYSE: JPM) is one of the oldest financial institutions in the United States. With a history dating back over 200 years, here's where we stand today:
We are a leading global financial services firm with assets of $2.6 trillion.
We have a presence in over 100 markets.
We have over 250,000 employees.
We serve millions of consumers, small businesses and many of the world's most prominent corporate, institutional and government clients.
We are a leader in investment banking, financial services for consumers and small businesses, commercial banking, financial transaction processing and asset management.
Our stock is a component of the Dow Jones Industrial Average.
Overview of their latest quarterly earnings
Our latest stock valuation of JPMorgan Chase: $135.90
We are a leading global financial services firm with assets of $2.6 trillion.
We have a presence in over 100 markets.
We have over 250,000 employees.
We serve millions of consumers, small businesses and many of the world's most prominent corporate, institutional and government clients.
We are a leader in investment banking, financial services for consumers and small businesses, commercial banking, financial transaction processing and asset management.
Our stock is a component of the Dow Jones Industrial Average.
Overview of their latest quarterly earnings
- Revenue: $29.22 billion (up from $28.2 billion for the same period of the previous year)
- Revenues increased by 3% over the last 12 months
- Total non interest expenses: $16.048 billion (down from $16.29 billion for the same period of the previous year)
- Total non interest expenses decreased by 2% over the last 12 months
- Some margin gain for JP Morgan as their revenues increased a lot more than their non interest expenses
- Net income: $12.13 billion (up from $8.52 billion for the same period of the previous year)
- Net income decreased by 42% over the last 12 months
- Diluted earnings per share: $3.79 (up from $2.57 for the same period of the previous year)
- PE ratio of JP Morgan Chase: 13.7
- Dividend declared: $0.90
- Dividend yield: 2.6%
- Diluted weighted-average shares outstanding: 3.085 billion (down from 3.148 billion for the same period of the previous year)
- Book value per share: $81.75 (up 8% from $75.98 for the same period of the previous year)
- Cash and cash equivalents: $24.87 billion
- Cash and cash equivalents per share: $8.06
- Cash and cash equivalents makes up 5.8% of JP Morgan Chase's market capital
- Cash and cash equivalents makes up 0.74% of JP Morgan Chase's total assets
- Cash and cash equivalents per share: $8.06
- Loans net of allowances for losses: $984.5 billion
- Loans net of allowances for losses 29.1% of JP Morgan Chase's total assets
- Goodwill: $53.4 billion
- Goodwill makes up 1.57% of JP Morgan Chase's total assets
- Goodwill per stock: $17.30
- Stockholders equity in JP Morgan Chase: $279.4 billion
- Stockholders equity per share: $90.56
- So JP Morgan Chase is trading a 1.53 times its stockholders equity which is outside the expected range of between 2 and 5 which most firms tend to trade at.
Our latest stock valuation of JPMorgan Chase: $135.90
More About Citi (C)
Citi, the leading global bank, has approximately 200 million customer accounts and does business in more than 160 countries and jurisdictions. Citi provides consumers, corporations, governments and institutions with a broad range of financial products and services, including consumer banking and credit, corporate and investment banking, securities brokerage, transaction services, and wealth management.
Overview of their latest quarterly earnings report
Our latest stock valuation of Citi: $96.80
Overview of their latest quarterly earnings report
- Revenue: $16.499 billion (up from $18.37 billion for the same period of the previous year)
- Revenues decreased by -10% over the last 12 months
- Operating costs and expenses : $10.7 billion (up from $10.45 billion for the same period of the previous year)
- Operating costs and expenses increased by 2% over the last 12 months
- Net income: $4.632 billion (down from $4.979 billion for the same period of the previous year)
- Diluted earnings per share: $2.08 (down from $2.15 for the same period of the previous year)
- PE ratio of Citigroup: 7.9
- Diluted weighted-average shares outstanding: 2.095 billion (down from 2.166 billion for the same period of the previous year)
- Book value per share: $86.59 (up 4% from $82.90 for the same period of the previous year)
- Cash and cash equivalents: $26.35 billion
- Cash and cash equivalents per share: $12.55
- Cash and cash equivalents makes up 19.2% of Citigroup's market capital
- Cash and cash equivalents makes up 1.16% of Citigroup's total assets
- Cash and cash equivalents per share: $12.55
- Loans net of allowances for losses: $650.9 billion
- Loans net of allowances makes up 28.7% of Citigroup's total assets
- Goodwill: $22.162 billion
- Goodwill makes up 0.98% of Citigroup's total assets
- Goodwill per stock: $10.57
- Stockholders equity in Citigroup: $200.5 billion
- Stockholders equity per share: $95.70
- So Citigroup is trading a 0.69 times its stockholders equity which is well outside the expected range of between 2 and 6 which most firms tend to trade at.
Our latest stock valuation of Citi: $96.80
Wells Fargo (WFC) vs JPMorgan Chase (JPM) vs Citigroup (C)
The image below shows the stock price performance of Bank of Wells Fargo (WFC), JPMorgan Chase (JPM), Citigroup (C) over the last 5 years. All of these firms are active in the banking and financial services sector in the USA. And their stock price trends look very similar, but the stock price returns are however very different. The summary below shows the stock price returns of the four mentioned firms over the last 5 years, sorted from best to worst performer
JPMorgan was by far the best performer and Wells Fargo by far the worst.
- JPMorgan Chase (JPM): 161.2%
- Citigroup (C): 83.6%
- Wells Fargo: 4.2%
JPMorgan was by far the best performer and Wells Fargo by far the worst.
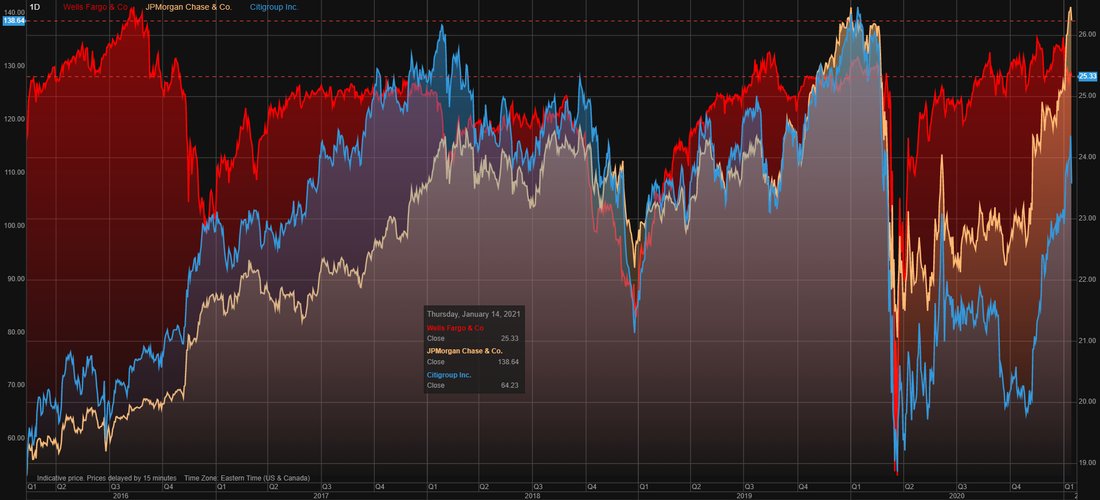
Wells Fargo (WFC) vs JPMorgan Chase (JPM) vs Citigroup (C) stock chart over last 5 years
Financial metrics comparison of the big banks
One of our key metrics is the Price to Stockholders equity per share ratio. When looking at this we find the following:
Based on this metric CitiGroup offers far more value than Wells Fargo and JPMorgan. Most firms tend to trade at a ratio of between 2 and 5 times. While all these firms are trading at well below the expected range its Citi who is trading at the lowest and based on this metric offers the most value.
Next up cash as percentage of stock price:
Next up lets take a look at the percentage cash on the balance sheet makes up of each group's total assets:
Looking at the cash position of the three firms Wells Fargo has the strongest cash position (as a percentage of their total assets). The cash per share gives an indication of if investors were to buy the stock now, how much of that stock price is made up by cash on their balance sheet. In this case its also Wells Fargo that comes out on top with almost 21.9% of their current stock price being made up by cash.
Next the overused but still useful metric, the Price to Earnings Ratio (PE):
So Citigroup has the lowest PE and Wells Fargo by far the highest.
Price/Stock Valuation ratio:
So all things considered if we have to choose between all of these financial service provider firms based on their current stock price, their latest earnings reported and stock price performance provided over the last 5 years, we rate the stock of CitiGroup as the Winner.
Its PE is the lowest of the three firms, it offers the most value when looking at our Price/Stock Valuation ratio, with it trading at almost 34% discount to our valuation, it has the second strongest cash position (based on cash as percentage of market capital as well as cash as percentage of total assets). And Citi offers the most value in terms of our Price/Stockholders equity per share metric. Therefore we rate the stock of Citi (C) as the clear winner in our latest battle of the banks.
- Price/Stockholders equity per share for CitiGroup: 0.69
- Price/Stockholders equity per share for JP Morgan : 1.35
- Price/Stockholders equity per share for Wells Fargo : 0.72
Based on this metric CitiGroup offers far more value than Wells Fargo and JPMorgan. Most firms tend to trade at a ratio of between 2 and 5 times. While all these firms are trading at well below the expected range its Citi who is trading at the lowest and based on this metric offers the most value.
Next up cash as percentage of stock price:
- Cash as percentage of stock price for CitiGroup: 19.2%
- Cash as percentage of stock price for JP Morgan : 5.8%
- Cash as percentage of stock price for Wells Fargo: 21.9%
Next up lets take a look at the percentage cash on the balance sheet makes up of each group's total assets:
- Cash as percentage of stock price for CitiGroup: 1.2%
- Cash as percentage of stock price for JP Morgan : 0.74%
- Cash as percentage of stock price for Wells Fargo: 1.4%
Looking at the cash position of the three firms Wells Fargo has the strongest cash position (as a percentage of their total assets). The cash per share gives an indication of if investors were to buy the stock now, how much of that stock price is made up by cash on their balance sheet. In this case its also Wells Fargo that comes out on top with almost 21.9% of their current stock price being made up by cash.
Next the overused but still useful metric, the Price to Earnings Ratio (PE):
- PE for CitiGroup: 7.8
- PE for JP Morgan : 9.2
- PE for Wells Fargo: 12.6
So Citigroup has the lowest PE and Wells Fargo by far the highest.
Price/Stock Valuation ratio:
- Price/Stock Valuation for CitiGroup: 0.66
- Price/Stock Valuation for JP Morgan : 1.02
- Price/Stock Valuation for Wells Fargo: 0.79
So all things considered if we have to choose between all of these financial service provider firms based on their current stock price, their latest earnings reported and stock price performance provided over the last 5 years, we rate the stock of CitiGroup as the Winner.
Its PE is the lowest of the three firms, it offers the most value when looking at our Price/Stock Valuation ratio, with it trading at almost 34% discount to our valuation, it has the second strongest cash position (based on cash as percentage of market capital as well as cash as percentage of total assets). And Citi offers the most value in terms of our Price/Stockholders equity per share metric. Therefore we rate the stock of Citi (C) as the clear winner in our latest battle of the banks.