
|
Related Topics
|
|
Category:Royal Caribbean Cruises (RCL), Carnival Corporation (CCL) and Norwegian Cruise Line (RCLH)
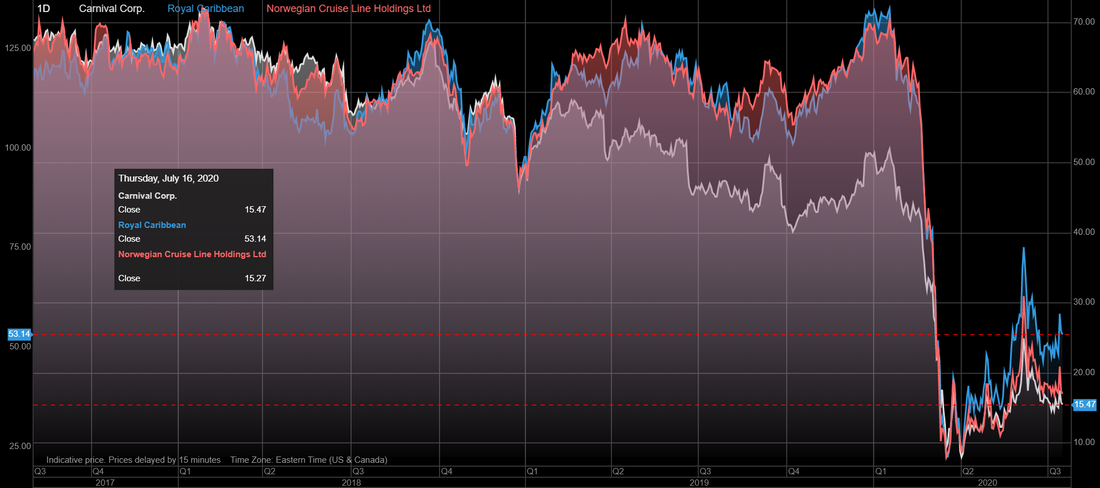
Date: 19 July 2020 Stock price of Royal Caribbean Cruises: $53.14 Stock price of Carnival Corporation: $15.47 Stock price of Norwegian Cruise Line : $15.27 Battle of the cruise liners. We take a look at the stock performance of Royal Caribbean Cruises, Carnival Corporation and Norwegian Cruise Lines over the last couple of years as well as investigate which one of these cruise liners comes out on top.
|

|
So if one had to buy one of these cruise line firms now which one is the best buy? Is there a reason why the stock of Royal Caribbean has outperformed the other two cruise liners or why Carnival Corporation has underperformed so horribly against the others?"
More About Royal Caribbean Cruises (RCL)
Royal Caribbean Cruises Ltd. (NYSE: RCL) is a global cruise vacation company that controls and operates four global brands: Royal Caribbean International, Celebrity Cruises, Azamara and Silversea Cruises. We are also a 50% joint venture owner of the German brand TUI Cruises and a 49% shareholder in the Spanish brand Pullmantur Cruceros. Together these brands operate a combined total of 61 ships with an additional 17 on order as of December 31, 2019. They operate diverse itineraries around the world that call on all seven continents.
Overview of Royal Caribbean Cruises latest earnings report
Overview of Royal Caribbean Cruises latest earnings report
- Revenue: $2.032 billion (down from $2.439 billion for the same quarter of the previous year)
- Revenues decreased by -16.7% over the last 12 months
- Total cruise operating expenses: $1.510 billion (up from $1.413 billion for the same quarter of the previous year)
- Total cruise operating expenses increased by 6.9% over the last 12 months
- Significant margin squeeze being experienced by Royal Caribbean Cruises with its costs and expenses growing while revenues declined
- Net loss: -$1.44 billion (down from $249 million for the same quarter of the previous year)
- Diluted loss per share: $6.91 (down from $1.19 profit for the same quarter of the previous year)
- Diluted number of shares outstanding: 209.097 million (down from 209.874 million for the same quarter of the previous year)
- Cash and cash equivalents: $3.890 billion
- Cash and cash equivalents per share: $18.60
- Cash and cash equivalents makes up 46.2% of the group's market capital
- Cash and cash equivalents makes up 11.6% of the group's total assets
- Cash and cash equivalents per share: $18.60
- Accounts receivable: $220.876 million
- Accounts receivable makes up 0.6% of total assets
- Property and equipment: $25.857 billion
- Property and equipment makes up 77.3% of Royal Caribbean Cruises
- Stockholders equity in Royal Caribbean Cruises: $10.231 billion
- Stockholders equity per share: $48.92
- So Royal Caribbean Cruises is trading at 0.82 times its stockholders equity per share which is outside the expected range of between 2 and 4 times that most firms tend to trade at
- For some perspective the average price to book value that firms in the S&P 500 trade at is 3.7 times. Read more about the S&P 500 here
- Stockholders equity per share: $48.92
- Cash generated from operations for the fiscal year: $198.710 million
- Cash generated from operations per share: $0.95
More About Carnival Corporation (CCL)
Carnival Corporation & plc, the world’s largest leisure travel company, provides travelers around the globe with extraordinary vacations at an exceptional value. The company’s portfolio of global cruise line brands includes Carnival Cruise Line, Holland America Line, Princess Cruises and Seabourn in North America; P&O Cruises (UK) and Cunard in Southampton, England; AIDA Cruises in Rostock, Germany; Costa Cruises in Genoa, Italy; and P&O Cruises (Australia) in Sydney. Additionally, Carnival Corporation owns a tour company that complements its cruise operations: Holland America Princess Alaska Tours which operates in Alaska and the Yukon.
Together, these brands comprise the world’s largest cruise company with a fleet of 102 ships visiting more than 700 ports around the world. A total of 19 new ships are scheduled to be delivered to Carnival Corporation between 2017 and 2022.
Carnival Corporation employs over 120,000 people worldwide and its 10 cruise line brands attract nearly 11.5 million guests annually, which is about 50 percent of the global cruise market. Combining more than 225,000 daily cruise guests and 100,000 shipboard employees, more than 325,000 people are sailing aboard the Carnival Corporation fleet every single day, totaling about 85 million passenger cruise days a year.
Carnival Corporation’s 10 leading brands offer a wide range of vacation experiences for millions of guests with varied leisure-time preferences from multiple backgrounds, cultures and languages. The company’s broad product offerings appeal to travelers of all kinds with many preferences, and consistently provide extraordinary vacation experiences at an outstanding value, especially when compared to similar land-based vacation options.
Overview of Carnival Corporation latest earnings report
- Revenue: $4.789 billion (up from $4.673 billion from the same quarter of the previous year)
- Revenue increased by 2.48% over the last 12 months
- Operating expenses: $3.523 billion (up from $3.142 billion for the same quarter of the previous year)
- Operating expenses increased by 12.1% over the last 12 months
- So some margin squeeze on Carnival as their operating expenses increased at a rate a lot faster than their revenues
- Net loss: -$781 million (down from $336 million for the same quarter of the previous year)
- Diluted loss per share: -$1.14 (down from $0.48 for the same quarter of the previous year)
- Diluted weighted-average shares outstanding: 685 million (down from 700 million for the same quarter of the previous year)
- Cash and cash equivalents: $1.354 billion
- Cash and cash equivalents per share: $1.97
- Cash and cash equivalents makes up 15.5% of Carnival Corporation's market capital
- Cash and cash equivalents makes up 2.88% of Carnival Corporation's total assets
- Cash and cash equivalents per share: $1.97
- Inventories: $440 million
- Inventories makes up 0.94% of Carnival Corporation's total assets
- Stockholders equity of Carnival Corporation: $24.290 billion
- Stockholders equity per share: $35.45
- Carnival Corporation is trading at 0.46 times its stockholders equity which is well outside the expected range of between 2 and 4 which most companies tend to trade at.
- For some perspective the average price to book value that firms in the S&P 500 trade at is 3.7 times. Read more about the S&P 500 here.
- Stockholders equity per share: $35.45
- Cash generated from operations: $916 million
- Cash generated from operations per share: $1.34
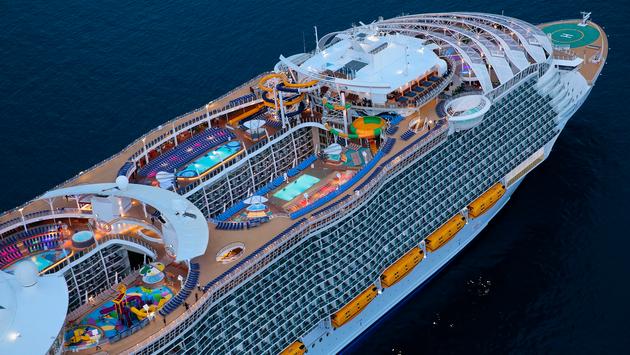
Royal Caribbean Cruises cruise ship
More About Norwegian Cruise Lines (NCLH)
Norwegian Cruise Line Holdings Ltd. (NYSE: NCLH) is a leading global cruise company which operates the Norwegian Cruise Line, Oceania Cruises and Regent Seven Seas Cruises brands. With a combined fleet of 28 ships with approximately 59,150 berths, these brands offer itineraries to more than 490 destinations worldwide. The Company will introduce nine additional ships through 2027.
Overview of Norwegian Cruise Line's latest earnings report
Overview of Norwegian Cruise Line's latest earnings report
- Total revenue: $1.246 billion (down from $1.403 billion for the same quarter of the previous year)
- Total revenue decreased by-11.2% over the last 12 months
- Total cruise operating expenses: $994.260 million (up from $826.651 million for the same quarter of the previous year)
- Total cruise operating expenses increased by 20.2% over the last 12 months
- The above shows the trouble that Norwegian Cruise Lines are in. Revenues declined by over 10% while operating costs increased by over 20%
- Net loss: -$1.888 billion (down from $118.157 million profit for the same quarter of the previous year)
- Diluted loss per share: -$8.80 (down from $0.54 for the same quarter of the previous year)
- PE ratio of Norwegian Cruise Line Holdings: Since the group is currently loss making a PE ratio cannot be calculated
- Diluted number of shares in issue: 213.630 million (down from 218.873 million for the same quarter of the previous year)
- Cash and cash equivalents: $1.360 billion
- Cash and cash equivalents per share: $6.36
- Cash and cash equivalents makes up 38.7% of Norwegian Cruise Line Holdings market capital
- Cash and cash equivalents makes up 8.3% of Norwegian Cruise Line Holdings total assets
- Cash and cash equivalents per share: $6.36
- Trade names of Norwegian Cruise Line Holdings: $500.5 million
- Trade names worth per Norwegian Cruise Line Holdings stock: $2.34
- Trade names makes up 3% of Norwegian Cruise Line Holdings' total assets
- Trade names worth per Norwegian Cruise Line Holdings stock: $2.34
- Stockholders equity in Norwegian Cruise Line Holdings: $4.374 billion
- Stockholders equity per share: $20.47
- Norwegian Cruise Line Holdings is trading at 0.81 times its stockholders equity per share which is well outside the expected range of between 2 and 4 times that most firms tend to trade at
- Stockholders equity per share: $20.47
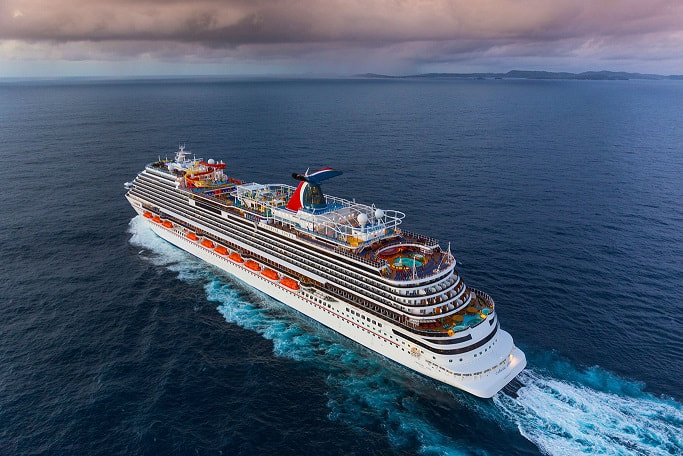
Carnival Corporation Cruise ship
Royal Caribbean Cruises (RCL) vs Carnival Corporation vs Norwegian Cruise Line (NCLH)
The image below shows the stock price performance of Royal Caribbean Cruises (RCL), Carnival Corporation and Norwegian Cruise Line Holdings over the last 3 years. All these firms are active in the cruise ship and entertainment industry. And as the image shows all three these firms suffered significant stock price declines since the start of the 2020. The summary below shows the stock price performance of the three major cruise lines in question, sorted from best to worst performer:
- Royal Caribbean Cruises: -54.73%
- Norwegian Cruise Line Holdings: -72.65%
- Carnival Corporation : -77.08%
Royal Caribbean Cruises (RCL) vs Carnival Corporation vs Norwegian Cruise Line (NCLH)
So if one had to buy one of these cruise line firms now which one is the best buy? Is there a reason why the stock of Royal Caribbean has outperformed the other two cruise liners or why Carnival Corporation has underperformed so horribly against the others?
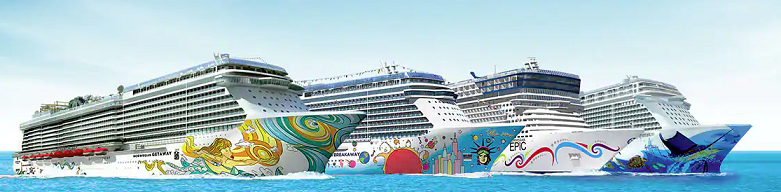
Norwegian cruise Line Holdings ships
One of our key metrics is the Price to Stockholders equity per share ratio. When looking at this we find the following:
Based on this metric Carnival Corporation offers far more value than Royal Caribbean and Norwegian Cruise Line. Most firms tend to trade at a ratio of between 2 and 4 times. While all these firms are trading at well below the expected range its Carnival Corporation who is trading at the lowest and based on this metric offers the most value.
Next up cash as percentage of stock price:
Next up lets take a look at the percentage cash on the balance sheet makes up of each group's total assets:
Looking at the cash position of the three cruise liners, when it comes to cash as percentage of market capital, Royal Caribbean has the highest percentage showing that if you buy the stock 21.8% of the stock price is made up by cash on the balance sheet. Looking at cash as percentage of total assets Norwegian Cruise Liners takes out the win in this metric, just ahead of Royal Caribbean Cruises. Therefore all things considered in our battle of the cruise liners we declare Norwegian Cruise Line as the WINNER
- Price/Stockholders equity per share for Royal Caribbean Cruises: 1.08
- Price/Stockholders equity per share for Carnival Corporation : 0.44
- Price/Stockholders equity per share for Norwegian Cruise Line Holdings: 0.74
Based on this metric Carnival Corporation offers far more value than Royal Caribbean and Norwegian Cruise Line. Most firms tend to trade at a ratio of between 2 and 4 times. While all these firms are trading at well below the expected range its Carnival Corporation who is trading at the lowest and based on this metric offers the most value.
Next up cash as percentage of stock price:
- Cash as percentage of stock price for Royal Caribbean Cruises 21.8%
- Cash as percentage of stock price for Carnival Corporation : 6.7%
- Cash as percentage of stock price for Norwegian Cruise Line Holdings: 14.8%
Next up lets take a look at the percentage cash on the balance sheet makes up of each group's total assets:
- Cash as percentage of stock price for Royal Caribbean Cruises: 1.05%
- Cash as percentage of stock price for Carnival Corporation : 0.64%
- Cash as percentage of stock price for Norwegian Cruise Line Holdings: 1.1%
Looking at the cash position of the three cruise liners, when it comes to cash as percentage of market capital, Royal Caribbean has the highest percentage showing that if you buy the stock 21.8% of the stock price is made up by cash on the balance sheet. Looking at cash as percentage of total assets Norwegian Cruise Liners takes out the win in this metric, just ahead of Royal Caribbean Cruises. Therefore all things considered in our battle of the cruise liners we declare Norwegian Cruise Line as the WINNER