|
Related Topics
|
|
Category:Union Pacific (UNP) and Norfolk Southern (NSC)
Date: 30 July 2020 Stock price of Union Pacific: $177.98 Stock price of Norfolk Southern: $192.82 Battle of the freight train stocks. We look at Norfolk Southern and Union Pacific's stock over the last couple of years as well as investigate which one of these two freight train stocks comes out on top and is best set to provide investors with superior returns over the next couple of years.
|


|
So if one had to buy one of these two freight train firms now which one is the best buy? Is there a reason why the stock of Union Pacific has underperformed against Norfolk Southern? Or does the underperformance of Union Pacific provide a good opportunity to buy into their stock instead of that of Norfolk Southern? Or is there a reason why Norfolk Southern is outperforming that of Union Pacific?"
More About Union Pacific (UNP)
Union Pacific Corporation (NYSE:UNP) is one of America's leading transportation companies. Its principal operating company, Union Pacific Railroad, is North America's premier railroad franchise, covering 23 states across the western two-thirds of the United States. The railroad's diversified business mix is classified into its Agricultural Products, Energy, Industrial and Premium business groups. Union Pacific serves many of the fastest-growing U.S. population centers, operates from all major West Coast and Gulf Coast ports to eastern gateways, connects with Canada's rail systems and is the only railroad serving all six major Mexico gateways. Union Pacific provides value to its roughly 10,000 customers by delivering products in a safe, reliable, fuel efficient and environmentally responsible manner
Union Pacific Railroad Fast Facts(For Full Year 2018)
Route Miles: 32,200
Employees: 42,000
Annual Payroll: $4.3 billion
Capital Spending :$3.2 billion
Capital Spending 2009-2018: $34 billion
Locomotives: 8,300
Customers: 10,000
Overview of Union Pacific's latest earnings report
Total operating revenues: $4.244 billion (down from $5.596 billion for the same quarter of the previous year)
Total operating revenues are down by -24% over the last 12 months
Total operating expenses: $2.590 billion (down from $3.336 billion for the same quarter of the previous year)
Total operating expenses decreased by -22.3% over the last 12 months
Some margin squeeze for Union Pacific with their revenues decreasing at a slower rate than their operating expenses
Net Income: $ 1.132 billion (down from $ 1.570 billion for the same quarter of the previous year)
Diluted earnings per share: $1.67 (down from $2.22 for the same quarter of the previous year)
PE ratio of Union Pacific: 2.9
Weighted average number of shares - diluted: 679.2 million (down from 708 million for the same quarter of the previous year)
Dividends declared per share: $0.97 (up 10% from $ 0.88 for the same quarter of the previous year)
Dividend yield of Union Pacific: 2.2%
Cash and cash equivalents: $2.706 billion
Cash and cash equivalents per share: $3.98
Cash and cash equivalents makes up 2.3% of Union Pacific's market capital
Cash and cash equivalents makes up 4.3% of Union Pacific's total assets
Stockholders' equity in Union Pacific : $16.452 billion
Stockholders equity per share: $24.22
So Union Pacific is trading at 7.23 times its stockholders equity per share, which is well outside the expected range of between 2 and 4 times that most firms tend to trade at.
Firms in the S&P 500 trades at an average price to book value of 3.7 times
More About Norfolk Southern (NSC)
Norfolk Southern Corporation (NYSE: NSC) is one of the nation's premier transportation companies. Its Norfolk Southern Railway Company subsidiary operates approximately 19,500 route miles in 22 states and the District of Columbia, serves every major container port in the eastern United States, and provides efficient connections to other rail carriers. Norfolk Southern is a major transporter of industrial products, including chemicals, agriculture, and metals and construction materials. In addition, the railroad operates the most extensive intermodal network in the East and is a principal carrier of coal, automobiles, and automotive parts.
Overview of Norfolk Southern latest earnings report
Overview of Norfolk Southern latest earnings report
- Revenues: $2.085 billion (down from $2.925 billion for the same quarter of the previous year)
- Revenue decreased by -28.7% over the last 12 months
- Operating expenses: $1.475 billion (down from $1.860 billion for the same quarter of the previous year)
- Operating expenses decreased by -20.6% over the last 12 months
- Net income: $392 million (down from a $722 million for the same quarter of the previous year)
- Diluted earnings per share: $1.53 (down from $2.70 for the same quarter of the previous year)
- PE ratio of Norfolk Southern : 31.3
- Diluted weighted-average shares outstanding: 256.7 million (down from 267.1 million for the same quarter of the previous year)
- Cash and cash equivalents: $1.143 billion
- Cash and cash equivalents per share: $4.45
- Cash and cash equivalents makes up 2.3% of Norfolk Southern market capital
- Cash and cash equivalents makes up 3% of Norfolk Southern total assets
- Cash and cash equivalents per share: $4.45
- Stockholders equity in Norfolk Southern: $14.861 billion
- Stockholders equity per share in Norfolk Southern: $57.89
- Norfolk Southern is trading at 3.25 times its stockholders equity per share which is within the expected range of between 2 and 4 times that most firms tend to trade at.
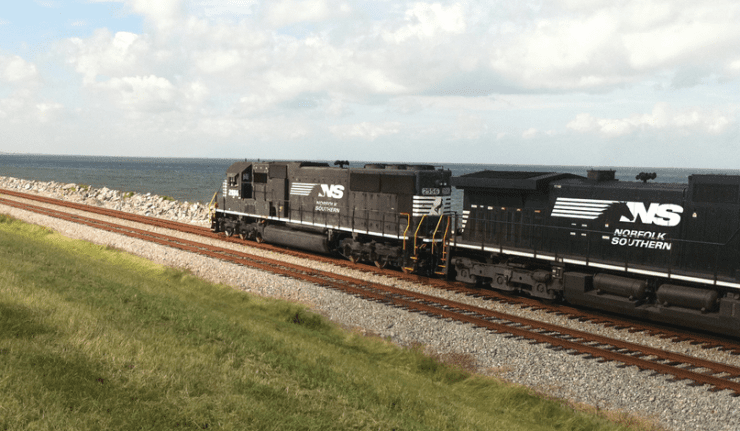
Norfolk Southern train
Union Pacific (UNP) stock vs Norfolk Southern (NCR) stock over the last 5 years
The image below shows the stock price performance of Union Pacific (UNP) stock and Norfolk Southern (NCR) over the last 5 years.
- Carnival Corporation : -77.08%

Union Pacific (UNP) stock vs Norfolk Southern (NCR) stock over the last 5 years
So if one had to buy one of these two freight train firms now which one is the best buy? Is there a reason why the stock of Union Pacific has underperformed against Norfolk Southern? Or does the underperformance of Union Pacific provide a good opportunity to buy into their stock instead of that of Norfolk Southern? Or is there a reason why Norfolk Southern is outperforming that of Union Pacific?

Union Pacific train
One of our key metrics is the Price to Stockholders equity per share ratio. When looking at this we find the following:
Based on this metric Norfolk Southern offers far more value than Union Pacific. Most firms tend to trade at a ratio of between 2 and 4 times. The higher this ratio the less value a stock offers. A ratio of 7.23 is implying that buying the stock of UNP now means you are paying 7.23 times more for the stock than what the stockholders equity per share is worth.
Next up cash as percentage of stock price:
Next up lets take a look at the percentage cash on the balance sheet makes up of each group's total assets:
Next up the PE ratio of the stock price:
Looking at all the fundamental metrics above Norfolk Southern wins on the Price/Stockholders equity per share metric, but loses out on the cash as percentage of total assets as well as on the PE ratio, therefore we believe that when it comes to the battle of freight train stocks we rate the stock of Union Pacific (UNP) as the WINNER
- Price/Stockholders equity per share for Union Pacific (UNP): 7.23
- Price/Stockholders equity per share for Norfolk Southern (NSC): 3.25
Based on this metric Norfolk Southern offers far more value than Union Pacific. Most firms tend to trade at a ratio of between 2 and 4 times. The higher this ratio the less value a stock offers. A ratio of 7.23 is implying that buying the stock of UNP now means you are paying 7.23 times more for the stock than what the stockholders equity per share is worth.
Next up cash as percentage of stock price:
- Cash as percentage of stock price for Union Pacific (UNP): 2.3%
- Cash as percentage of stock price for Norfolk Southern (NSC) : 2.3%
Next up lets take a look at the percentage cash on the balance sheet makes up of each group's total assets:
- Cash as percentage of stock price for Union Pacific (UNP) : 4.3%
- Cash as percentage of stock price for Norfolk Southern (NSC) : 3%
Next up the PE ratio of the stock price:
- PE ratio for Union Pacific (UNP) : 25.4
- PE ratio for Norfolk Southern (NSC) : 31.3
Looking at all the fundamental metrics above Norfolk Southern wins on the Price/Stockholders equity per share metric, but loses out on the cash as percentage of total assets as well as on the PE ratio, therefore we believe that when it comes to the battle of freight train stocks we rate the stock of Union Pacific (UNP) as the WINNER