|
Related Topics
|
|
Category: JDeere & Co (DE) and Caterpillar (CAT)
Date: 1 December 2020 Stock price of Deere & Co (DE): $261.62 Stock price of Caterpillar (CAT): $173.59 In our continued stock face of series we compare the stocks of two of the worlds largest machinery and equipment manufacturers. John Deere & CO (DE) vs Caterpillar (CAT). Which firm has provided the better returns in recent history and which firm is best set to outperform going forward.
|
|
Based on this metric it is Caterpillar (CAT) that takes the win. So what is the stockholders equity per share you ask? Well if a firm sells all assets, pays all its debts and distributes the rest to its stockholders, the stockholders equity per share shows what each stockholders will get. Thus the higher this ratio the less you will get out per stock compared to what you are paying for it. So Deere & Co that is trading at 6.4 times it stockholders equity you will only get 15.6% of its current stock price out of they were to sell all assets, pay all debt and distribute the rest to stockholders. In the case of Caterpillar (CAT) you would get 15.8% of its current stock price out "
More About Deere & Co
John Deere has developed a strategy to grow and sustain its successful global business. To learn more about our strategy, please watch the video featuring Chairman and CEO Sam Allen.
Since 1837, John Deere has capitalized on the opportunities presented by increasing population, prosperity, and urbanization. Today, broad trends based on population and income growth, especially in developing nations, are driving agricultural output and infrastructure investment. Further, technological advances and agricultural mechanization are expanding existing markets and opening new ones.
We believe John Deere is exceptionally well-positioned to seize these opportunities and fulfill our higher purpose of helping improve living standards for people everywhere through our commitment to those linked to the land.
Overview of the latest quarterly earnings report of Deere & Co
Our latest stock valuation of Deere & Co: $180.40
Since 1837, John Deere has capitalized on the opportunities presented by increasing population, prosperity, and urbanization. Today, broad trends based on population and income growth, especially in developing nations, are driving agricultural output and infrastructure investment. Further, technological advances and agricultural mechanization are expanding existing markets and opening new ones.
We believe John Deere is exceptionally well-positioned to seize these opportunities and fulfill our higher purpose of helping improve living standards for people everywhere through our commitment to those linked to the land.
Overview of the latest quarterly earnings report of Deere & Co
- Total revenue: $9.731billion (down from $9.896 billion for the same quarter of the previous year)
- Total revenue decreased by -2% over the last 12 months
- Total expenses: $8.616 billion (down from $9.071 billion for the same quarter of the previous year)
- Total expenses decreased by -5% over the last 12 months
- Some margin gain for Deere and Co as their revenues decreased at a slower rate than that of their total expenses
- Net earnings: $757 million (up from $722 million for the same quarter of the previous year)
- Diluted earnings per share: $2.39 (up from $2.27 for the same quarter of the previous year)
- PE ratio of Deere and Company: 30
- Diluted number of shares outstanding: 316.6 million (down from 320.6 million for the same quarter of the previous year)
- Cash and cash equivalents: $7.066 billion
- Cash and cash equivalents per share: $22.31
- Cash and cash equivalents makes up 8.6% of Deere and Company's market capital
- Cash and cash equivalents makes up 9.4% of Deere and Company's total assets
- Cash and cash equivalents per share: $22.31
- Trade accounts and notes receivables: $4.171 billion
- Trade accounts and notes receivables makes up 5.6% of Deere and Company's total assets
- Inventories $5.817billion
- Inventories makes up 7.7% of Deere and Company's total assets
- Finance receivables: $29.750 billion
- Finance receivables makes up 39.6% of Deere and Company's total assets
- Stockholders’ equity in Deere and Company: $12.944 billion
- Stockholders equity per share: $40.88
- Deere and Company is trading at 6.4 times its stockholders equity per share which is within the expected range of between 2 and 4 times that most firms tend to trade at
- For some perspective the average price to book value of firms in the S&P 500 is 3.9
- Stockholders equity per share: $40.88
- Cash generated from operations: $7.483 billion
- Cash generated from operations per share: $23.6
Our latest stock valuation of Deere & Co: $180.40

More About Caterpillar (CAT)
For more than 90 years, Caterpillar Inc. has been making sustainable progress possible and driving positive change on every continent. Customers turn to Caterpillar to help them develop infrastructure, energy and natural resource assets. With 2018 sales and revenues of $54.722 billion, Caterpillar is the world’s leading manufacturer of construction and mining equipment, diesel and natural gas engines, industrial gas turbines and diesel-electric locomotives. The company principally operates through its three primary segments - Construction Industries, Resource Industries and Energy & Transportation - and also provides financing and related services through its Financial Products segment.
Overview of the latest quarterly earnings report of Caterpillar (CAT)
Our latest stock valuation of Caterpillar: $131.10
Overview of the latest quarterly earnings report of Caterpillar (CAT)
- Total Revenues: $9.88 billion (down from $12.75 billion for the same quarter of the previous year)
- Total Revenues decreased by -22.% over the last 12 months
- Operating costs: $8.89 billion (down from $10.74 billion for the same quarter of the previous year)
- Operating costs decreased by-17.2% over the last 12 months
- Net income: $668 million (down from $1.49 billion for the same quarter of the previous year)
- Diluted earnings per share: $1.22 (down from $2.66 for the same quarter of the previous year)
- PE ratio of Caterpillar: 32
- Diluted weighted-average shares outstanding: 546.4 million (down from 561.2 million for the same quarter of the previous year)
- Cash and cash equivalents: $9.315 billion
- Cash and cash equivalents per share: $17.04
- Cash and cash equivalents makes up 9.8% of Caterpillar's market capital
- Cash and cash equivalents makes up 12.1% of Caterpillar's total assets
- Cash and cash equivalents per share: $17.04
- Accounts receivable- finance: $8.966 billion
- Accounts receivable makes up 11.7% of Caterpillar's total assets
- Inventories: $11.5 billion
- Inventories makes up 15% of Caterpillar's total assets
- Stockholders equity of Caterpillar: $14.994 billion
- Stockholders equity per share: $27.44
- So Caterpillar' is trading at 6.3 times its stockholders equity which is outside the expected range of between 2 and 4 times that most firms tend to trade at.
- To put this into perspective the average firm on the S&P500 trades at a price to book value of 3.9
- Stockholders equity per share: $27.44
- Cash generated from operations for 9 months : $4.255 billion
- Cash generated from operations per share for 9 months : $7.78
Our latest stock valuation of Caterpillar: $131.10
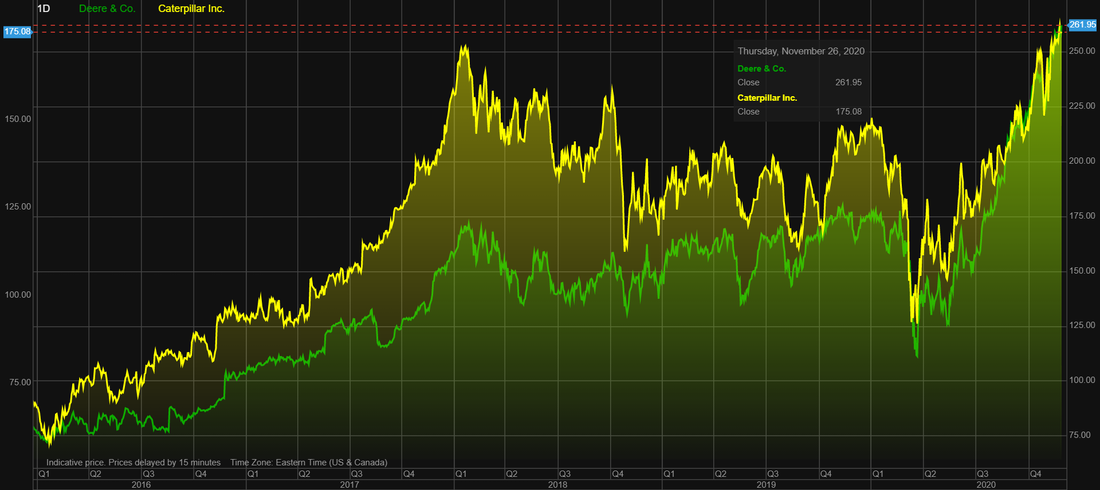
Deere & Co (DE) stock vs Caterpillar (CAT) stock price over the last 5 years
The image below shows the stock price performance of Deere and Company (DE) compared to the stock price performance of Caterpillar (CAT) over the last 5 years. As the image below shows the trend of these two companies' stock price is very similar. The summary below shows the stock price returns provided by these two firms over the last 5 years.
The stock of Deere has easily outperformed that of Caterpillar over the last 5 years.
- Deere and Company (DE): 229.1%
- Caterpillar (CAT): 152.4%
The stock of Deere has easily outperformed that of Caterpillar over the last 5 years.
Deere & Co (DE) stock vs Caterpillar (CAT) stock price over the last 5 years
Financial fundamentals comparison between Deere & Co (DE) and Caterpillar (CAT)
So let's take a look at the fundamentals and the valuation metrics in order to determine which of these two firms offers the most value at their current stock price.
One of our key metrics is the Price to Stockholders equity per share ratio. When looking at this we find the following:
Based on this metric it is Caterpillar (CAT) that takes the win. So what is the stockholders equity per share you ask? Well if a firm sells all assets, pays all its debts and distributes the rest to its stockholders, the stockholders equity per share shows what each stockholders will get. Thus the higher this ratio the less you will get out per stock compared to what you are paying for it. So Deere & Co that is trading at 6.4 times it stockholders equity you will only get 15.6% of its current stock price out of they were to sell all assets, pay all debt and distribute the rest to stockholders. In the case of Caterpillar (CAT) you would get 15.8% of its current stock price out
Next up cash as percentage of stock price:
Next up lets take a look at the percentage cash on the balance sheet makes up of each group's total assets:
So based on the cash position of these two firms when it comes to cash as percentage of stock price Caterpillar (CAT) comes off as the winner,and when it comes to the Cash as percentage of the total assets it is Caterpillar again that comes out as the winner.
Next lets take a look at the most overused financial ratio around. The Price to Earnings ratio.
Next up the PE ratio of the stocks:
One of our key metrics is the Price to Stockholders equity per share ratio. When looking at this we find the following:
- Price/Stockholders equity per share for Caterpillar (CAT): 6.3
- Price/Stockholders equity per share for Deere & Co (DE): 6.4
Based on this metric it is Caterpillar (CAT) that takes the win. So what is the stockholders equity per share you ask? Well if a firm sells all assets, pays all its debts and distributes the rest to its stockholders, the stockholders equity per share shows what each stockholders will get. Thus the higher this ratio the less you will get out per stock compared to what you are paying for it. So Deere & Co that is trading at 6.4 times it stockholders equity you will only get 15.6% of its current stock price out of they were to sell all assets, pay all debt and distribute the rest to stockholders. In the case of Caterpillar (CAT) you would get 15.8% of its current stock price out
Next up cash as percentage of stock price:
- Cash as percentage of stock price for Caterpillar (CAT): 9.8%
- Cash as percentage of stock price for Deere & Co (DE) : 8.6%
Next up lets take a look at the percentage cash on the balance sheet makes up of each group's total assets:
- Cash as percentage of stock price for Caterpillar (CAT) : 12.11%
- Cash as percentage of stock price for Deere & Co (DE): 9.4%
So based on the cash position of these two firms when it comes to cash as percentage of stock price Caterpillar (CAT) comes off as the winner,and when it comes to the Cash as percentage of the total assets it is Caterpillar again that comes out as the winner.
Next lets take a look at the most overused financial ratio around. The Price to Earnings ratio.
Next up the PE ratio of the stocks:
- PE ratio for Caterpillar (CAT): 32
- PE ratio for Deere & Co (DE) : 30
Price relative to stock valuation
Looking at all the fundamental metrics above it is Caterpillar that wins on the Price/Stockholders equity per share metric. Caterpillar also wins when it comes to the cash as percentage of stock price. Caterpillar (CAT) has the stronger cash position with their cash as percentage of total assets being higher than that of Deere & Co (DE). So of the first three metrics Caterpillar beats Deer & Co on all three
When looking at the PE ratio it is Deere & Co that wins as it has the lower PE ratio. Caterpillar wins the Price/Stock valuation ratio as it is trading at closer to our latest stock valuation of the group with it trading at about 32.4% above our latest stock valuation (target price) for the group while Deere & Co is trading at 45% above our latest stock valuation (target price) for the group
Therefore all things considered in the battle between Caterpillar (CAT) vs Deere & Co (DE) we rate the stock of Caterpillar (CAT) as the clear winner in the battle of the machinery and equipment firms
- Price/Stock Valuation ratio for Caterpillar (CAT): 1.324
- Price/Stock Valuation ratio for Deere & Co (DE) 1.45
Looking at all the fundamental metrics above it is Caterpillar that wins on the Price/Stockholders equity per share metric. Caterpillar also wins when it comes to the cash as percentage of stock price. Caterpillar (CAT) has the stronger cash position with their cash as percentage of total assets being higher than that of Deere & Co (DE). So of the first three metrics Caterpillar beats Deer & Co on all three
When looking at the PE ratio it is Deere & Co that wins as it has the lower PE ratio. Caterpillar wins the Price/Stock valuation ratio as it is trading at closer to our latest stock valuation of the group with it trading at about 32.4% above our latest stock valuation (target price) for the group while Deere & Co is trading at 45% above our latest stock valuation (target price) for the group
Therefore all things considered in the battle between Caterpillar (CAT) vs Deere & Co (DE) we rate the stock of Caterpillar (CAT) as the clear winner in the battle of the machinery and equipment firms