|
Related Topics
|
|
Category: Domino's Pizza (DPZ) and Papa Johns (PZZA)
Date: 13 August 2020 Stock price of Domino's: $396.67 Stock price of Papa Johns: $95.17 Battle of the pizza franchise stocks. We take a look at Domino's Pizza (DPZ) and Papa Johns (PZZA) stock over the last couple of years as well as investigate which one of these two pizza franchise groups is best placed to provide investors with superior returns based on their current stock price and fundamentals. Lets dig into this and slice up the two pizza firms to identify the best value pizza franchise stock between the two.
|

|
So if one had to buy one of these two retail firms now which one is the best buy? Is there a reason why the stock of Dollar Tree has underperformed against Dollar General? Or does the underperformance of Dollar Tree provide a good opportunity to buy into their stock instead of that of Dollar General? Or is there a reason why Dollar General is outperforming that of Dollar Tree?"
More About Papa Johns (PZZA)
The secret to success is much like the secret to making a better pizza - the more you put into it, the more you get out of it. Our pizza family is as hungry for perfection today as we were when we first opened our doors more than 30 years ago. And we're driven to be the best at making innovative new products and recipes.
Quality is at our core. It’s the foundation we started with, from the first Papa John's pizza that was made in a broom closet in Jeffersonville, IN, to now more than 5,000 locations in 45 countries and territories around the world.
We don’t use cheap and more processed ingredients. Whether it's our signature sauce, toppings, our original fresh dough, or even the box itself, we invest in our ingredients to ensure that we always give you the finest quality pizza.
For you, it’s not just a better pizza. It’s a family gathering, memorable birthday, work celebration or simply a great meal. It’s our goal to make sure you always have the best ingredients for every occasion.
Overview of Papa John's latest earnings report
Our latest stock valuation of Papa Johns: $67.10
Quality is at our core. It’s the foundation we started with, from the first Papa John's pizza that was made in a broom closet in Jeffersonville, IN, to now more than 5,000 locations in 45 countries and territories around the world.
We don’t use cheap and more processed ingredients. Whether it's our signature sauce, toppings, our original fresh dough, or even the box itself, we invest in our ingredients to ensure that we always give you the finest quality pizza.
For you, it’s not just a better pizza. It’s a family gathering, memorable birthday, work celebration or simply a great meal. It’s our goal to make sure you always have the best ingredients for every occasion.
Overview of Papa John's latest earnings report
- Total Revenues: $460.623 million (up from $399.623 million for the same quarter of the previous year)
- Total Revenues increased by 15.3% over the last 12 months
- Total costs and expenses: $430.089 million (up from $385.555 million for the same quarter of the previous year)
- Total costs and expenses increased by 11.6% over the last 12 months
- Some margin gain for Papa Johns as revenues increased at a faster rate than their expenses
- Net income: $20.614 million (up from $8.354 million for the same quarter of the previous year)
- Diluted earnings per share: $0.48 (down from $0.15 for the same quarter of the previous year)
- PE ratio: 48.3
- Dividend declared: $0.225
- Dividend yield: 0.9%
- Diluted weighted-average shares outstanding: 32.6 million (up from 31.7 million for the same quarter of the previous year)
- Cash and cash equivalents: $75.699 million
- Cash and cash equivalents per share: $2.32
- Cash and cash equivalents makes up 2.48% of Papa John's market capital
- Cash and cash equivalents makes up 5.1% of Papa John's total assets
- Cash and cash equivalents per share: $2.32
- Accounts receivable: $77.607 million
- Accounts receivable makes up 10.8% of Papa John's s total assets
- Cash generated from operations for the first 1st quarter of 2020: $33.734 million
- Cash generated from operations per share for first 1 quarter of 2020: $1.04
Our latest stock valuation of Papa Johns: $67.10
More About Domino's Pizza (DPZ)
Founded in 1960, Domino’s Pizza is the largest pizza company in the world based on retail sales, with a significant business in both delivery and carryout pizza. It ranks among the world’s top public restaurant brands with a global enterprise of more than 16,300 stores in over 85 markets. Domino’s had global retail sales of over $13.5 billion in 2018, with nearly $6.6 billion in the U.S. and more than $6.9 billion internationally. In the second quarter of 2019, Domino’s had global retail sales of over $3.2 billion, with over $1.6 billion in the U.S. and over $1.6 billion internationally. Its system is comprised of independent franchise owners who accounted for 98% of Domino's stores as of the second quarter of 2019. Emphasis on technology innovation helped Domino’s achieve more than half of all global retail sales in 2018 from digital channels.
In the U.S., Domino’s generates over 65% of sales via digital channels and has developed several innovative ordering platforms, including Google Home, Facebook Messenger, Apple Watch, Amazon Echo and Twitter – as well as Domino’s HotSpots®, an ordering platform featuring over 200,000 unique, non-traditional delivery locations. In late 2017, Domino’s began an industry-first test of self-driving vehicle delivery, and in June 2019 announced a partnership with Nuro, furthering its exploration and testing of autonomous pizza delivery.
Total Revenues: $920.023 million (up from $811.647 million for the same quarter of the previous year)
Total Revenues increased by 13.3% over the last 12 months
Cost of sales: $562.923 million (up from $494.976 million for the same quarter of the previous year)
Cost of sales increased by 13.7% over the last 12 months
Net income: $188.668 million (up 104% from $92.359 million for the same quarter of the previous year)
Diluted earnings per share: $2.99 (up from $2.19 for the same quarter of the previous year)
PE ratio: 34
Dividend declared: $0.78
Dividend yield: 0.76%
Diluted weighted-average shares outstanding: 39.746 million (down from 42.236 million for the same quarter of the previous year)
Cash and cash equivalents: $247.952 million
Cash and cash equivalents per share: $6.23
Cash and cash equivalents makes up 1.53% of Domino's market capital
Cash and cash equivalents makes up 15.7% of Domino's total assets
Accounts receivable: $232.114 million
Accounts receivable makes up 14.7% of Domino's total assets
Cash generated from operations for the first 2 quarter of 2020: $211.828 million
Cash generated from operations per share for first 2 quarters of 2020: $5.32
valuation $209.40

Slice of Papa Johns Pizza
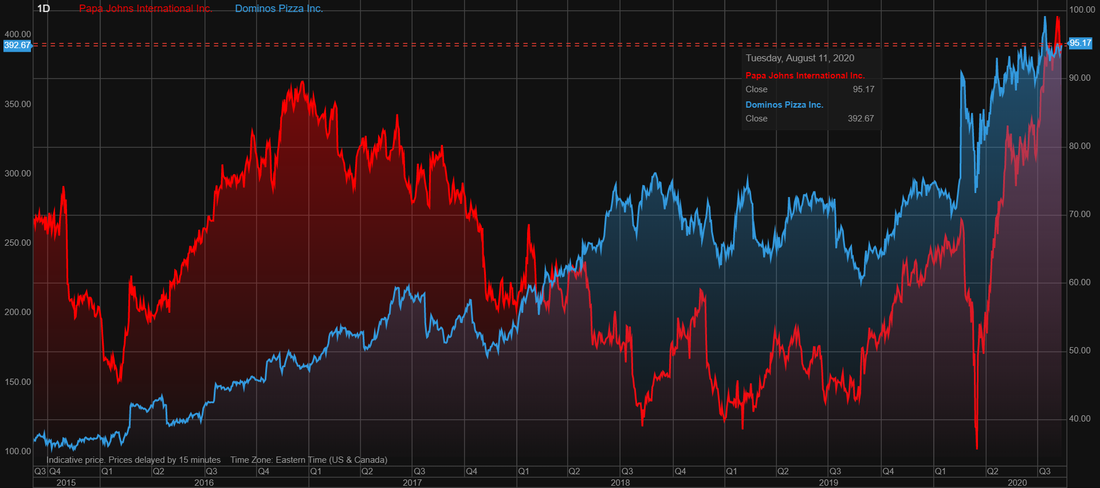
Papa Johns (PZZA) vs Domino's Pizza (DPZ) stock performance over the last 5 years
The image below shows the stock price performance of Papa Johns (PZZA) and Domino's Pizza (DPZ) over the last 5 years. While both are retailers largely based in the USA the stock price trends of the two firms are very different. Below the stock price returns provided by the two stocks over the last 5 years.
The stock of Domino's has easily outperformed the stock of Papa Johns over the last 5 years.
- Domino's Pizza: 272.7%
- Papa Johns: 41.7%
The stock of Domino's has easily outperformed the stock of Papa Johns over the last 5 years.
Dollar Tree (DLTR) stock vs Dollar General (DG) stock performance over the last 5 years
So if one had to buy one of these two pizza franchise stocks now which one is the best buy? Is there a reason why the stock of Papa Johns has underperformed against Domino's? Or does the underperformance of Papa Johns provide a good opportunity to buy into their stock instead of that of Domino's? Or is there a reason why Domino's is outperforming that of Papa Johns?

Domino's Pizza
So let's take a look at the fundamentals and the valuation metrics in order to determine which of these two firms offers the most value at their current stock price.
One of our key metrics is the Price to Stockholders equity per share ratio. When looking at this we find the following:
Most firms tend to trade at a ratio of between 2 and 4 times its stockholders equity per share. The higher this ratio the less value a stock offers. However a stockholders deficit shows that a company's assets is less than its liabilities. And this is the case for both Domino's Pizza and Papa Johns.
Next up cash as percentage of stock price:
Next up lets take a look at the percentage cash on the balance sheet makes up of each group's total assets:
Next up the PE ratio of the stock price:
Price relative to our valuation:
Neither of the two companies has stockholders equity, as both are trading at stockholders deficits. Domino's Pizza is in the better cash position than Papa Johns based on the their cash as percentage of total assets percentage. And it is also trading at lower PE ratio than that of Papa Johns but it is trading at further away from our stock price target than what Papa Johns is. And it is for this reasons that we rate the stock of Papa Johns as the winner.
One of our key metrics is the Price to Stockholders equity per share ratio. When looking at this we find the following:
- Price/Stockholders equity per share for Papa Johns (PZZA): Stockholders deficit so this ratio cannot be calculated
- Price/Stockholders equity per share for Domino's Pizza (DPZ): Stockholders deficit so this ratio cannot be calculated
Most firms tend to trade at a ratio of between 2 and 4 times its stockholders equity per share. The higher this ratio the less value a stock offers. However a stockholders deficit shows that a company's assets is less than its liabilities. And this is the case for both Domino's Pizza and Papa Johns.
Next up cash as percentage of stock price:
- Cash as percentage of stock price for Papa Johns: 2.5%
- Cash as percentage of stock price for Domino's Pizza (DPZ): 1.53%
Next up lets take a look at the percentage cash on the balance sheet makes up of each group's total assets:
- Cash as percentage of stock price for Papa Johns (PZZA): 5.1%
- Cash as percentage of stock price for Domino's Pizza (DPZ): 15.7%
Next up the PE ratio of the stock price:
- PE ratio for Papa Johns: 48.3
- PE ratio for Domino's Pizza : 34
Price relative to our valuation:
- Papa Johns (PZZA): 41.8% overvalued based on our latest stock valuation
- Domino's Pizza (DPZ): 89.5% overvalued based on our latest stock valuation
Neither of the two companies has stockholders equity, as both are trading at stockholders deficits. Domino's Pizza is in the better cash position than Papa Johns based on the their cash as percentage of total assets percentage. And it is also trading at lower PE ratio than that of Papa Johns but it is trading at further away from our stock price target than what Papa Johns is. And it is for this reasons that we rate the stock of Papa Johns as the winner.