|
Related Topics
|
|
Category: Kroger (KR) and Dollar General (DG)
Date: 6 December 2020 Stock price of Kroger (KR): $30.58 Stock price of Dollar General (DG): $213.43 In our continued stock face of series we compare the stocks of two of the worlds largest retailers. Kroger (KR) vs Dollar General (DG). Which firm has provided the better returns in recent history and which firm is best set to outperform going forward.
|

|
Looking at all the fundamental metrics above it is Kroger that wins on the Price/Stockholders equity per share metric. It is Dollar General that wins when it comes to the cash as percentage of stock price. Dollar General also has the stronger cash position with their cash as percentage of total assets being higher than that of Kroger (KR). So of the first three metrics Dollar General wins two and Kroger wins one. "
More About Kroger (KR)
The Kroger Co. was founded in 1883 and incorporated in 1902. As of February 1, 2020, Kroger is one of the world’s largest retailers, as measured by revenue, operating 2,757 supermarkets under a variety of local banner names in 35 states and the District of Columbia. Of these stores, 2,270 have pharmacies and 1,567 have fuel centers. We offer Pickup (also referred to as ClickList®) and Harris Teeter ExpressLane™ — personalized, order online, pick up at the store services — at 1,989 of our supermarkets and provide home delivery service to 97% of Kroger households. We also operate an online retailer. We operate 35 food production plants, primarily bakeries and dairies, which supply approximately 31% of Our Brands units and 42% of the grocery category Our Brands units sold in our supermarkets; the remaining Our Brands items are produced to our strict specifications by outside manufacturers. Our revenues are predominately earned and cash is generated as consumer products are sold to customers in our stores, fuel centers and via our online platforms. We earn income predominately by selling products at price levels that produce revenues in excess of the costs we incur to make these products available to our customers. Such costs include procurement and distribution costs, facility occupancy and operational costs, and overhead expenses. Our retail operations, which represent 97% of our consolidated sales, is our only reportable segment.
Overview of the latest quarterly earnings report of Kroger (KR)
Our latest stock valuation of Kroger (KR): $47.10
Overview of the latest quarterly earnings report of Kroger (KR)
- Sales: $29.7 billion (up from $27.9 billion from the same quarter of the previous year)
- Sales increased by 6.5% over the last 12 months
- Net income: $631 million (up from $263 million for the same quarter of the previous year)
- Net profit margin for Kroger: 2.12%
- Diluted earnings per share: $0.81 (up from $0.32 for the same quarter of the previous year)
- PE ratio of Kroger: 6.8
- Dividend declared for the quarter: $0.18 (up from $0.16 for the same quarter of the previous year)
- Dividend yield: 2.3%
- Diluted weighted-average shares outstanding: 780 million (down from 807 million for the same quarter of the previous year)
- Cash and cash equivalents: $367 million
- Cash and cash equivalents per share: $0.47
- Cash and cash equivalents makes up 1.5% of Kroger's market capital
- Cash and cash equivalents makes up 0.75 % of Kroger's total assets
- Accounts receivable: $1.61 billion
- Accounts receivable makes up 3.4% of the Kroger's total assets.
- Inventories: $7.47 billion (up from $7.41 billion for the same quarter of the previous year)
- Inventories makes up 15.4% of Kroger's total assets
- Inventories increased slightly by 0.8% over the last 12 months
- Stockholders equity in Kroger: $10.04 billion
- Stockholders equity per share: $12.87
- The Kroger Company is trading at 2.39 times its stockholders equity per share which is within the expected range of between 2 and 5 times that most firms tend to trade at
- The average price to book value of firms in the S&P500 is 3.9
Our latest stock valuation of Kroger (KR): $47.10
More About Dollar General (DG)
Dollar General Corporation has been delivering value to shoppers for more than 80 years. Dollar General helps shoppers Save time. Save money. Every day!® by offering products that are frequently used and replenished, such as food, snacks, health and beauty aids, cleaning supplies, basic apparel, housewares and seasonal items at everyday low prices in convenient neighborhood locations. Dollar General operated 16,278 stores in 44 states as of January 31, 2020. In addition to high-quality private brands, Dollar General sells products from America's most-trusted manufacturers such as Clorox, Energizer, Procter & Gamble, Hanes, Coca-Cola, Mars, Unilever, Nestle, KimberlyClark, Kellogg's, General Mills, and PepsiCo.
Overview of the latest quarterly earnings report of Dollar General (DG):
Our latest stock valuation of Dollar General (DG): $182.20
Overview of the latest quarterly earnings report of Dollar General (DG):
- Total sales: $8.199 billion (up from $6.99 billion from the same quarter of the previous year)
- Sales increased by 17.2% over the last 12 months
- Cost of goods sold: $5.631 billion (up from $4.926 billion for the same quarter of the previous year)
- Cost of goods sold increased by 14.3% over the last 12 months
- Some margin gain for Dollar General as their sales increased at a faster rate than their cost of goods sold
- Net income : $574.2 million (up from $365.55 million for the same quarter of the previous year)
- Diluted income per share: $2.31 (up from $1.42 for the same quarter of the previous year)
- PE ratio of Dollar General (DG): 23.1
- Diluted weighted-average shares outstanding: 249.06 million (down from 257.7 million for the same quarter of the previous year)
- Cash and cash equivalents: $2.199 billion
- Cash and cash equivalents per share: $8.82
- Cash and cash equivalents makes up 4.1% of Dollar General's market capital
- Cash and cash equivalents makes up 8.4% of Dollar General's total assets
- Cash and cash equivalents per share: $8.82
- Inventories: $5.025 billion
- Inventories makes up 19.2% of Dollar General's total assets
- Stockholders equity in Dollar General: $6.985 billion
- Stockholders equity per share: $28
- Dollar General is trading at 7.6 times its stockholders equity which is well outside the expected range of between 2 and 5 times that most firms tend to trade at
- Stockholders equity per share: $28
Our latest stock valuation of Dollar General (DG): $182.20
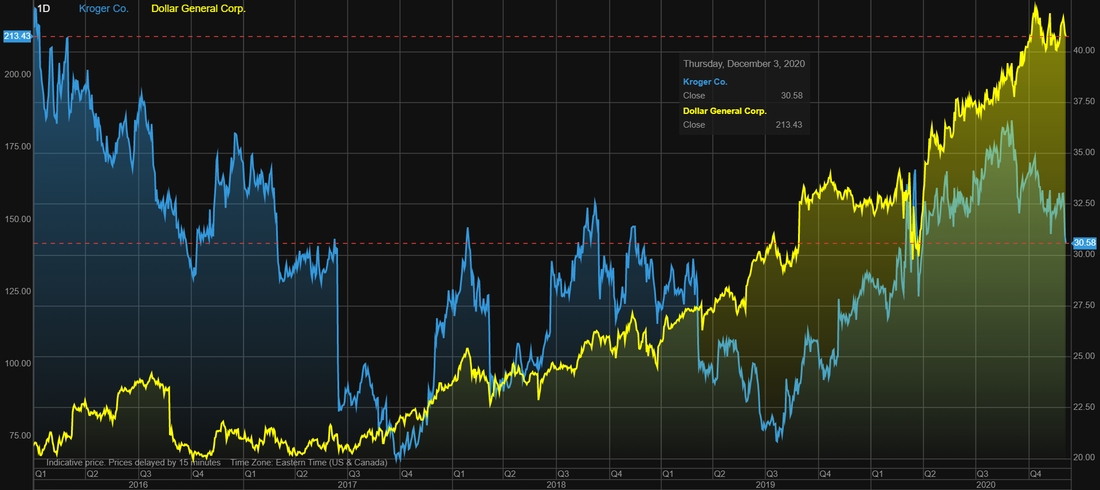
Kroger (KR) vs Dollar General (DG) stock price over the last 5 years
The image below shows the stock price performance of Kroger (KR) vs Dollar General (DG) stock price over the last 5 years As the image below shows the trend of these two companies' stock price is very similar. The summary below shows the stock price returns provided by these two firms over the last 5 years.
The stock of Dollar General (DG) has easily outperformed that of Kroger (KR) over the last 5 years.
- Dollar General (DG): 197%
- Kroger (KR): -26.8%
The stock of Dollar General (DG) has easily outperformed that of Kroger (KR) over the last 5 years.
Deere & Co (DE) stock vs Caterpillar (CAT) stock price over the last 5 years
Financial fundamentals comparison between Kroger and Dollar General
So let's take a look at the fundamentals and the valuation metrics in order to determine which of these two firms offers the most value at their current stock price.
One of our key metrics is the Price to Stockholders equity per share ratio. When looking at this we find the following:
Based on this metric it is Kroger (KR) that takes the win. So what is the stockholders equity per share you ask? Well if a firm sells all assets, pays all its debts and distributes the rest to its stockholders, the stockholders equity per share shows what each stockholders will get. Thus the higher this ratio the less you will get out per stock compared to what you are paying for it. So Dollar General that is trading at 7.6 times it stockholders equity you will only get 13.2% of its current stock price out of they were to sell all assets, pay all debt and distribute the rest to stockholders. In the case of Kroger (KR) you would get 41.6% of its current stock price out
Next up cash as percentage of stock price:
Next up lets take a look at the percentage cash on the balance sheet makes up of each group's total assets:
So based on the cash position of these two firms when it comes to cash as percentage of stock price Dollar General (DG) comes off as the winner,and when it comes to the Cash as percentage of the total assets it is Dollar General again that comes out as the winner.
Next let's take a look at the most overused financial ratio around. The Price to Earnings ratio.
Next up the PE ratio of the stocks:
One of our key metrics is the Price to Stockholders equity per share ratio. When looking at this we find the following:
- Price/Stockholders equity per share for Kroger (KR): 2.4
- Price/Stockholders equity per share for Dollar General (DG): 7.6
Based on this metric it is Kroger (KR) that takes the win. So what is the stockholders equity per share you ask? Well if a firm sells all assets, pays all its debts and distributes the rest to its stockholders, the stockholders equity per share shows what each stockholders will get. Thus the higher this ratio the less you will get out per stock compared to what you are paying for it. So Dollar General that is trading at 7.6 times it stockholders equity you will only get 13.2% of its current stock price out of they were to sell all assets, pay all debt and distribute the rest to stockholders. In the case of Kroger (KR) you would get 41.6% of its current stock price out
Next up cash as percentage of stock price:
- Cash as percentage of stock price for Kroger (KR): 1.5%
- Cash as percentage of stock price for Dollar General (DG) : 4.1%
Next up lets take a look at the percentage cash on the balance sheet makes up of each group's total assets:
- Cash as percentage of stock price for Kroger (KR) : 0.75%
- Cash as percentage of stock price for Dollar General (DG): 8.4%
So based on the cash position of these two firms when it comes to cash as percentage of stock price Dollar General (DG) comes off as the winner,and when it comes to the Cash as percentage of the total assets it is Dollar General again that comes out as the winner.
Next let's take a look at the most overused financial ratio around. The Price to Earnings ratio.
Next up the PE ratio of the stocks:
- PE ratio for Kroger (KR): 6.8
- PE ratio for Dollar General (DG) : 23.1

Price relative to stock valuation
Looking at all the fundamental metrics above it is Kroger that wins on the Price/Stockholders equity per share metric. It is Dollar General that wins when it comes to the cash as percentage of stock price. Dollar General also has the stronger cash position with their cash as percentage of total assets being higher than that of Kroger (KR). So of the first three metrics Dollar General wins two and Kroger wins one.
When looking at the PE ratio it is Kroger that wins as it has the lower PE ratio. Kroger also wins the Price/Stock valuation ratio as it is trading at below our latest stock valuation of the group with it trading at about 35.1% below our latest stock valuation (target price) for the group while Dollar General is trading at 17% above our latest stock valuation (target price) for the group
Therefore all things considered in the battle between Kroger (KR) vs Dollar General (DG) we rate the stock of Kroger (KR) as the narrow winner in the battle of the retailers.
- Price/Stock Valuation ratio for Kroger (KR): 0.649
- Price/Stock Valuation ratio for Dollar General (DG) 1.17
Looking at all the fundamental metrics above it is Kroger that wins on the Price/Stockholders equity per share metric. It is Dollar General that wins when it comes to the cash as percentage of stock price. Dollar General also has the stronger cash position with their cash as percentage of total assets being higher than that of Kroger (KR). So of the first three metrics Dollar General wins two and Kroger wins one.
When looking at the PE ratio it is Kroger that wins as it has the lower PE ratio. Kroger also wins the Price/Stock valuation ratio as it is trading at below our latest stock valuation of the group with it trading at about 35.1% below our latest stock valuation (target price) for the group while Dollar General is trading at 17% above our latest stock valuation (target price) for the group
Therefore all things considered in the battle between Kroger (KR) vs Dollar General (DG) we rate the stock of Kroger (KR) as the narrow winner in the battle of the retailers.