
|
Related Topics
|
|
Category: Lululemon (LULU) and Under Armour (UAA)
Date: 6 July 2020 Stock price of Lululemon (LULU): $304.77 Stock price of Under Armour: $9.58 Battle of the sports apparel and accessories firms. We take a look at Lululemon (LULU) and Under Armour (UAA) stock performance over the last couple of years and look at which stock offers the best prospects for future growth based on their current financial position and their current stock price.
|

|
So if one had to buy one of these two sporting apparel stocks now which one is the better buy? Does the stock of Under Armour provide a greater buying opportunity because it declined significantly while the stock of Lululemon surged over the same time period? Or is there a fundamental reason why the stock of Under Armour struggled so much while the stock of Lululemon exceled? "
More About Lululemon (LULU)
lululemon athletica inc. (NASDAQ:LULU) is a healthy lifestyle inspired athletic apparel company for yoga, running, training, and most other sweaty pursuits, creating transformational products and experiences which enable people to live a life they love. Setting the bar in technical fabrics and functional designs, lululemon works with yogis and athletes in local communities for continuous research and product feedback.
A few quick facts about Lululemon
Highlights of Lululemon's latest quarter earnings
A few quick facts about Lululemon
- Lululemon is listed on the Nasdaq under share code ticker: LULU
- Lululemon has 491 company operated retail outlets
- Lululemon employs roughly 19 000 people
Highlights of Lululemon's latest quarter earnings
- Net sales: $651.926 million (down from $782.315 million from the same quarter of the previous year)
- Lululemon's net sales decrease by -16.7% over the last 12 months
- Cost of goods sold : $317.560 million (down from $360.595 million for the same quarter of the previous year)
- Cost of goods sold decreased by -11.9% over the last 12 months.
- Some margin squeezed being experienced by Lululemon as revenue declined at a faster rate than their cost of sales for the 1st quarter of their 2020 fiscal year
- Net income: $28.632 million (down from $93.603 million for the same quarter of the previous year)
- Diluted earnings per share: $0.22 (down from $0.74 for the same quarter of the previous year)
- PE ratio: 350 (based on the earnings per share for the current quarter being reported for full fiscal year)
- Diluted earnings per share: $0.22 (down from $0.74 for the same quarter of the previous year)
- Diluted weighted-average shares outstanding: 130.251 million (down from 130.694 million for the same quarter of the previous year)
- Cash and cash equivalents: $823.006 million
- Cash and cash equivalents per share: $6.32
- Cash and cash equivalents makes up 2.00% of Lululemon's current market capital
- Cash and cash equivalents makes up 25.7% of Lululemon's total assets
- Cash and cash equivalents per share: $6.32
- Inventories: $625.849 million (up from $443.006 million for the same quarter of the previous year)
- Inventories makes up 19.5% of Lululemons total assets
- Inventories grew by 41.3% over the last year
- It is concerning to see Lululemons inventories build up so strongly with the value of their inventories increased by over 40% over the last 12 months
- Total stockholders' equity of Lululemon's: $1.835 billion
- Stockholders' equity per share: $14.1
- Lululemon is trading at 21.8 times ist stockholders equity which is well outside the expected range of between 2 and 4 times that most firms tend to trade at
More About Under Armour (UAA)
Under Armour, Inc., headquartered in Baltimore, Maryland, is a leading inventor, marketer and distributor of branded athletic performance apparel, footwear and accessories. Powered by one of the world’s largest digitally connected fitness and wellness communities, Under Armour’s innovative products and experiences are designed to help advance human performance, making all athletes better
Highlights of Under Armour's latest quarter earnings
Highlights of Under Armour's latest quarter earnings
- Net revenues: $930.240 million (down from $1.204 billion for the same quarter of the previous year)
- Net revenues decreased by -22.7% over the last 12 months
- Cost of goods sold: $499.256 million (down from $659.935 million for the same quarter of the previous year)
- Cost of goods sold decreased by -24.3% over the last 12 months
- Net loss: -$589.681 million (down from $22.477 million for the same quarter of the previous year)
- Diluted loss per share: -$1.30 (down from $0.05 for the same quarter of the previous year)
- Number of shares in issue: 452.871 million (down from 453.230 million for the same quarter of the previous year)
- Cash and cash equivalents: $959.318 million
- Cash and cash equivalents per share: $2.11
- Cash and cash equivalents makes up 22.1% of Under Armour's market capital
- Cash and cash equivalents makes up 19.8% of Under Armour's total assets
- Cash and cash equivalents per share: $2.11
- Accounts receivable: $668.409 million
- Accounts receivable makes up 13.8% of Under Armour's total assets
- Inventories: $940.236 million
- Inventories makes up 19.4% of Under Armour's total assets
- Goodwill in Under Armour: $485.672 million
- Goodwill per share: $1.07
- Goodwill makes up 11.2% of Under Armour's total assets
- Goodwill per share: $1.07
- Stockholders equity in Under Armour: $1.550 billion
- Stockholders equity per share: $3.42
- So Under Armour is trading at 2.8 times its stockholders equity per share which is well within the expected range of between 2 and 4 times that most firms tend to trade at
lululemon store front
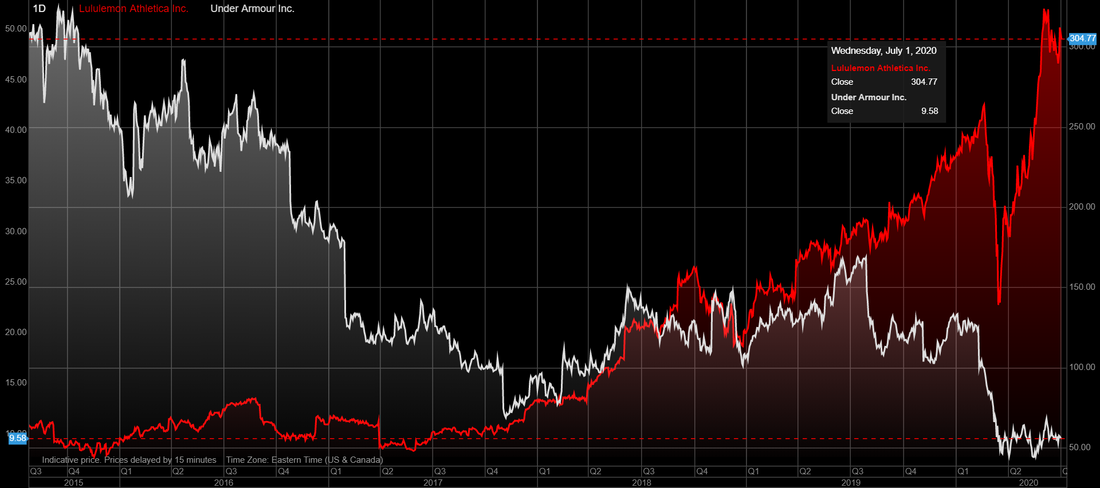
Lululemon (LULU) vs Under Armour (UAA)
The image below shows the stock price performance of Lululemon and Under Armour over the last 3 years. Both these firms are active in the sports apparel and accessories sector but their stock price trends are totally different. In fact their stock price performance looks like inverses of one one another. As the one goes up the other goes down. Over the three year period the stock of Under Armour declined by -80.61% while the stock of Lululemon increased by 378.15% over the same time period.
So does the stock of Under Armour provide a greater buying opportunity because it has decline significantly over the three year period while the stock of Lululemon skyrocketed over the same three year period or is there a fundamental financial reason why it has declined while so much while the stock of Lululemon increased signficantly
So does the stock of Under Armour provide a greater buying opportunity because it has decline significantly over the three year period while the stock of Lululemon skyrocketed over the same three year period or is there a fundamental financial reason why it has declined while so much while the stock of Lululemon increased signficantly
Lululemon (LULU) vs Under Armour (UAA)
So if one had to buy one of these two sporting apparel stocks now which one is the better buy? Does the stock of Under Armour provide a greater buying opportunity because it declined significantly while the stock of Lululemon surged over the same time period? Or is there a fundamental reason why the stock of Under Armour struggled so much while the stock of Lululemon exceled?
Under Armour store front
One of our key metrics is the Price to Stockholders equity per share ratio. When looking at this we find the following for both stocks:
Based on this metric Under Armour offers far more value than Lululemon. Most firms tend to trade at a ratio of between 2 and 4 times. Lululemon is trading at well above the expected range and Under Armour is trading at inside the expected range. Next up cash as percentage of stock price. Cash per share makes up just over 2% of lululemon's stock price while Under Armour's cash makes up 22.1% of their stock price. Total cash as percentage of total assets is as follows.
Cash makes up 25.7% of lululemon's total assets while Under Armour's cash makes up around 19.8% of their total assets. So it does look like lululemon is better placed to ride out difficult times as is currently being experienced during Covid-19 as their cash as percentage of total assets is far greater than that of Under Armour and they would therefore be far less likely to borrow money to keep their operations afloat during the Covid-19 pandemic.
Taking all of the above into consideration, the fact that Under Armour was loss making during their last quarter while Lululemon made significant profits gives Lululemon a early head start. Lululemon is trading with what looks like a far stronger balance sheet considering the cash as a percentage of their total assets. Which gives Lululemon an even bigger lead. But Lululemon is however trading at a far higher Price/Stockholders equity per share ratio while Under Armor is within the expected range. All things considered we rate the stock of Lululemon as the WINNER.
- Price/Stockholders equity per share for Lululemon: 21.8
- Price/Stockholders equity per share for Under Armour: 2.8
Based on this metric Under Armour offers far more value than Lululemon. Most firms tend to trade at a ratio of between 2 and 4 times. Lululemon is trading at well above the expected range and Under Armour is trading at inside the expected range. Next up cash as percentage of stock price. Cash per share makes up just over 2% of lululemon's stock price while Under Armour's cash makes up 22.1% of their stock price. Total cash as percentage of total assets is as follows.
Cash makes up 25.7% of lululemon's total assets while Under Armour's cash makes up around 19.8% of their total assets. So it does look like lululemon is better placed to ride out difficult times as is currently being experienced during Covid-19 as their cash as percentage of total assets is far greater than that of Under Armour and they would therefore be far less likely to borrow money to keep their operations afloat during the Covid-19 pandemic.
Taking all of the above into consideration, the fact that Under Armour was loss making during their last quarter while Lululemon made significant profits gives Lululemon a early head start. Lululemon is trading with what looks like a far stronger balance sheet considering the cash as a percentage of their total assets. Which gives Lululemon an even bigger lead. But Lululemon is however trading at a far higher Price/Stockholders equity per share ratio while Under Armor is within the expected range. All things considered we rate the stock of Lululemon as the WINNER.