
|
Related Topics
|
|
Category: BJ's Wholesale Club (BJ) and PriceSmart (PSMT)
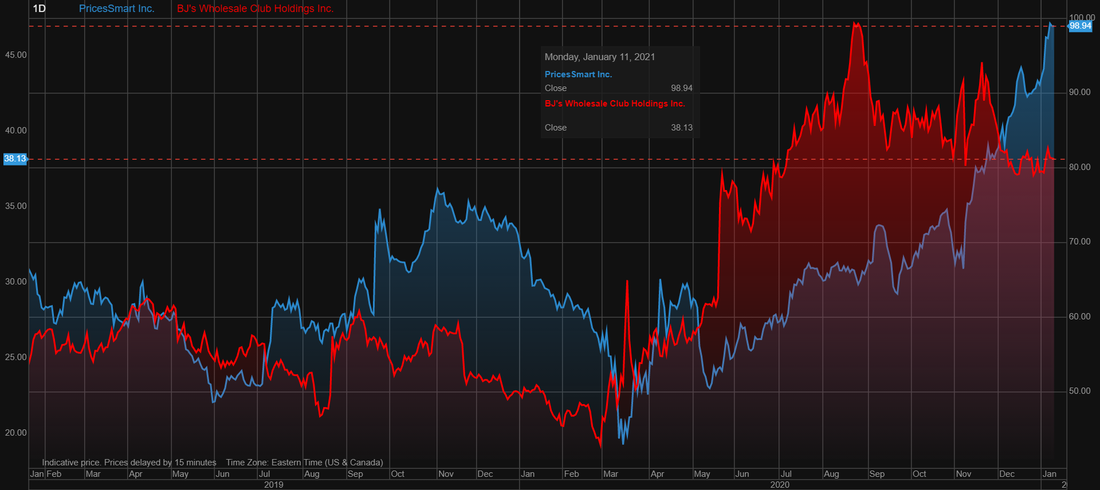
Date: 12 January 2021 Stock price of PriceSmart: $97.94 Stock price of BJ's Wholesale: $38.50 We compare the stock price performance of PriceSmart (PSMT) and BJ's Wholesale Club (BJ) over the last 2 years as well as compare the two firms latest earnings reports in order to determine which of these two wholesale membership style firms is best placed to outperform in coming years.
|
|
|
Despite the challenges of the COVID-19 global pandemic, we were still able to achieve a strong start to the year "
More About PriceSmart
PriceSmart, headquartered in San Diego, owns and operates U.S.-style membership shopping warehouse clubs in Latin America and the Caribbean, selling high quality merchandise and services at low prices to PriceSmart Members. PriceSmart operates 47 warehouse clubs in 12 countries and one U.S. territory (eight in Costa Rica and Colombia; seven in Panama; five in the Dominican Republic, four in Trinidad and Guatemala; three in Honduras; two each in El Salvador and Nicaragua; and one each in Aruba, Barbados, Jamaica and the United States Virgin Islands). The Company also plans to open new warehouse clubs in Guatemala City, Guatemala and Portmore, Jamaica in the fall of 2021 and the spring of 2022, respectively. Once these two new clubs are open, the Company will operate 49 warehouse clubs.

Inside a PriceSmart store
The data below refers to the latest quarter unless specified otherwise:
- Net merchandise sales: $838.4 million (up from $778.7 million from the same quarter of the previous year)
- Merchandise sales increased by 7.6% over the last 12 months
- Total operating expenses: $832.982 million (up from $781.2 million for the same quarter of the previous year)
- Total operating expenses increased by 6.6% over the last 12 months
- Some margin gain for BJ's wholesale as revenues outpaced the growth in their cost of sales.
- Net income: $27.817 million (up from $19.7 million loss for the same quarter of the previous year)
- Diluted earnings per share: $0.90 (up from $0.64 for the same quarter of the previous year)
- PE ratio of PriceSmart: 27.6
- Diluted weighted-average shares outstanding: 30.4 million (up from 30.28 million for the same quarter of the previous year)
- Cash and cash equivalents: $207.955 million
- Cash and cash equivalents per share: $6.84
- Cash and cash equivalents makes up 6.8% of PriceSmart market capital
- Cash and cash equivalents makes up 12.3% of PriceSmart total assets
- Cash and cash equivalents per share: $6.84
- Receivables: $15.15 million
- Receivables makes up 0.9% of PriceSmart total assets
- Inventories: $373.2 million
- Inventories makes up 22.2% of PriceSmart total assets
- Stockholders equity in PriceSmart: $867.3 million
- Stockholders equity per share of PriceSmart: $28.5
- So PriceSmart is trading at 3.5 times its stockholders equity per share which is within the expected range of between 2 and 5 times that most firms tend to trade at
- Stockholders equity per share of PriceSmart: $28.5
More About BJ's Wholesale Club
BJ’s Wholesale Club is a leading warehouse club operator in the Eastern United States. We deliver significant value to our members, consistently offering 25% or more savings on a representative basket of manufacturer-branded groceries compared to traditional supermarket competitors. We provide a curated assortment focused on perishable products, continuously refreshed general merchandise, gasoline and other ancillary services to deliver a differentiated shopping experience, that is further enhanced by our omnichannel capabilities. Since pioneering the warehouse club model in New England in 1984, we have grown our footprint to 217 large-format, high volume warehouse clubs spanning 17 states. In our core New England markets, which have high population density and generate a disproportionate part of U.S. GDP, we operate almost three times the number of clubs of the next largest warehouse club competitor. In addition to shopping in our clubs, members are able to shop when and how they want through our website, www.bjs.com; our highly-rated mobile app; and our integrated Instacart same-day delivery offering.
Over the last four years, we have made multiple senior management hires and changes, adding consumer packaged goods, digital and consulting experience to our leadership team. This leadership team has implemented significant cultural and operational changes to our business, including transforming how we use data to improve member experience, instilling a culture of cost discipline, adopting a more proactive approach to growing our membership base and building an omnichannel offering oriented towards making shopping at BJ's more convenient. These changes have delivered results rapidly, evidenced by income from continuing operations growth of 16%, positive comparable club sales over the last ten quarters and adjusted EBITDA growth of 9% over the last three years. Our goal is to offer our members significant value and a meaningful return, in savings, on their annual membership fee. We have approximately 5.5 million members paying annual fees to gain access to savings on groceries, consumables, general merchandise, gas and ancillary services. The annual membership fee for our Inner Circle® Membership is $55 per year, and our BJ’s Perks Rewards® Membership, which offers additional value-enhancing features, costs $110 annually.
We believe that members can save over ten times their $55 Inner Circle membership fee versus what they would have paid at traditional supermarket competitors when they spend $2,500 or more per year at BJ’s on manufacturer-branded groceries. In addition to providing significant savings on a representative basket of manufacturer-branded groceries, we accept all manufacturer coupons and also carry our own exclusive brands that enable members to save on price without compromising on quality. Our two private label brands, Wellsley Farms® and Berkley Jensen® , represent over $2.0 billion in sales, and are the largest brands we sell. Our customers recognize the relevance of our value proposition across economic environments, as demonstrated by over 20 consecutive years of membership fee income growth. Our membership fee income was $302.2 million for fiscal year 2019
The data below refers to the latest quarter unless specified otherwise:
- Total revenue: $3.871 billion (up from $3.271 billion from the same quarter of the previous year)
- Revenues increased by 18.3% over the last 12 months
- Cost of Sales: $3.197 billion (up from $2.733 billion for the same quarter of the previous year)
- Cost of sales increased by 16.9% over the last 12 months
- Some margin gain for BJ's wholesale as the surge in revenues outpaced the growth in their cost of sales.
- Net income: $106.618 million (up from $54.523 million loss for the same quarter of the previous year)
- Diluted earnings per share: $0.76 (up from $0.39 for the same quarter of the previous year)
- PE ratio of BJ's wholesale: 15.8
- Diluted weighted-average shares outstanding: 139.5 million (unchanged from 139.5 million for the same quarter of the previous year)
- Cash and cash equivalents: $168.811 million
- Cash and cash equivalents per share: $1.21
- Cash and cash equivalents makes up 2.62% of BJ's Wholesale Club's market capital
- Cash and cash equivalents makes up 3.2% of BJ's Wholesale Club's total assets
- Cash and cash equivalents per share: $1.21
- Receivables: $170.595 million
- Receivables makes up 3.2% of BJ's Wholesale Club's total assets
- Inventories: $1.005 billion
- Inventories makes up 18.9% of BJ's Wholesale Club's total assets
- Cash generated from operations for 6 months: $733.692 million
- Cash generated from operations per share for 6 months: $5.25
PriceSmart (PSMT) vs BJ Wholesale Club (BJ) stock over the last 2 years
The image below shows the stock price performance of BJ Wholesale (BJ) vs PriceSmart (PSMT) stock price over the last 2 years As the image below shows the trend of these two companies' stock price is very similar. The summary below shows the stock price returns provided by these two firms over the last 2 years.
The stock of BJ Wholesale (BJ) has just outperformed that of PriceSmart (PSMT) over the last 2 years
- PriceSmart (PSMT): 49.3%
- BJ Wholesale (BJ): 54.2%
The stock of BJ Wholesale (BJ) has just outperformed that of PriceSmart (PSMT) over the last 2 years
PriceSmart (PSMT) vs BJ Wholesale Club (BJ) stock over the last 2 years
Financial fundamentals comparison between BJ Wholesale and PriceSmart
So let's take a look at the fundamentals and the valuation metrics in order to determine which of these two firms offers the most value at their current stock price.
One of our key metrics is the Price to Stockholders equity per share ratio. When looking at this we find the following:
Based on this metric it is PriceSmart (PSMT) that takes the win. So what is the stockholders equity per share you ask? Well if a firm sells all assets, pays all its debts and distributes the rest to its stockholders, the stockholders equity per share shows what each stockholders will get. Thus the higher this ratio the less you will get out per stock compared to what you are paying for it. So PriceSmart that is trading at 3.5 times it stockholders equity you will only get 28.5% of its current stock price out of they were to sell all assets, pay all debt and distribute the rest to stockholders. In the case of BJ Wholesale (BJ) you would get nothing as their liabilities outstrips their assets and there is no stockholders equity.
Next up cash as percentage of stock price:
Next up lets take a look at the percentage cash on the balance sheet makes up of each group's total assets:
So based on the cash position of these two firms when it comes to cash as percentage of stock price PriceSmart (PSMT) comes off as the winner,and when it comes to the Cash as percentage of the total assets it is PriceSmart again that comes out as the winner.
Next let's take a look at the most overused financial ratio around. The Price to Earnings ratio.
Next up the PE ratio of the stocks:
One of our key metrics is the Price to Stockholders equity per share ratio. When looking at this we find the following:
- Price/Stockholders equity per share for BJ Wholesale (BJ): BJ's Wholesale has a stockholders deficit
- Price/Stockholders equity per share for PriceSmart (PSMT): 3.5
Based on this metric it is PriceSmart (PSMT) that takes the win. So what is the stockholders equity per share you ask? Well if a firm sells all assets, pays all its debts and distributes the rest to its stockholders, the stockholders equity per share shows what each stockholders will get. Thus the higher this ratio the less you will get out per stock compared to what you are paying for it. So PriceSmart that is trading at 3.5 times it stockholders equity you will only get 28.5% of its current stock price out of they were to sell all assets, pay all debt and distribute the rest to stockholders. In the case of BJ Wholesale (BJ) you would get nothing as their liabilities outstrips their assets and there is no stockholders equity.
Next up cash as percentage of stock price:
- Cash as percentage of stock price for BJ Wholesale (BJ): 2.6%
- Cash as percentage of stock price for PriceSmart (PSMT) : 6.8%
Next up lets take a look at the percentage cash on the balance sheet makes up of each group's total assets:
- Cash as percentage of stock price for BJ Wholesale (BJ) : 3.2%
- Cash as percentage of stock price for PriceSmart (PSMT): 12.3%
So based on the cash position of these two firms when it comes to cash as percentage of stock price PriceSmart (PSMT) comes off as the winner,and when it comes to the Cash as percentage of the total assets it is PriceSmart again that comes out as the winner.
Next let's take a look at the most overused financial ratio around. The Price to Earnings ratio.
Next up the PE ratio of the stocks:
- PE ratio for BJ Wholesale (BJ): 15.8
- PE ratio for PriceSmart (PSMT) : 27.6
Price relative to stock valuation
Looking at all the fundamental metrics above it is PriceSmart that wins on the Price/Stockholders equity per share metric. It is PriceSmart that wins when it comes to the cash as percentage of stock price. PriceSmart also has the stronger cash position with their cash as percentage of total assets being higher than that of BJ Wholesale (BJ). So of the first three metrics PriceSmart wins all three.
When looking at the PE ratio it is BJ Wholesale that wins as it has the lower PE ratio. BJ Wholesale also wins the Price/Stock valuation ratio as it is trading at further below our stock valuation than the stock of PriceSmart that is trading at closer to our stock valuation.
Therefore all things considered in the battle between BJ Wholesale (BJ) vs PriceSmart (PSMT) we rate the stock of PriceSmart (PSMT) as the winner in the battle of the wholesale member stores. But PriceSmart wins by the narrowest of margins.
- Price/Stock Valuation ratio for BJ Wholesale (BJ): 0.89
- Price/Stock Valuation ratio for PriceSmart (PSMT): 0.98
Looking at all the fundamental metrics above it is PriceSmart that wins on the Price/Stockholders equity per share metric. It is PriceSmart that wins when it comes to the cash as percentage of stock price. PriceSmart also has the stronger cash position with their cash as percentage of total assets being higher than that of BJ Wholesale (BJ). So of the first three metrics PriceSmart wins all three.
When looking at the PE ratio it is BJ Wholesale that wins as it has the lower PE ratio. BJ Wholesale also wins the Price/Stock valuation ratio as it is trading at further below our stock valuation than the stock of PriceSmart that is trading at closer to our stock valuation.
Therefore all things considered in the battle between BJ Wholesale (BJ) vs PriceSmart (PSMT) we rate the stock of PriceSmart (PSMT) as the winner in the battle of the wholesale member stores. But PriceSmart wins by the narrowest of margins.
Related Topics