|
Related Topics
|
|
Category: Stock Market and Carter's Inc.
Date: 15 October 2019 Stock Price: $94.16 We take a look at the 2nd quarter earnings report of their 2019 fiscal year of Carter's Inc. the largest branded marketer in North America of apparel and related products for babies and young children.
|
|
About Carter's Inc.
Carter’s, Inc. is the largest branded marketer in North America of apparel and related products exclusively for babies and young children. The Company owns the Carter's and OshKosh B'gosh brands, two of the most recognized brands in the marketplace. These brands are sold in leading department stores, national chains, and specialty retailers domestically and internationally. They are also sold through more than 1,000 Company-operated stores in the United States, Canada, and Mexico and on-line at www.carters.com, www.oshkosh.com, and www.cartersoshkosh.ca. The Company's Child of Mine brand is available at Walmart, its Just One You brand is available at Target, and its Simple Joys brand is available on Amazon. The Company also owns Skip Hop, a global lifestyle brand for families with young children. Carter's is headquartered in Atlanta, Georgia.
Overview of Carter's Inc.'s latest earnings report
Data below refers to quarterly data unless specified otherwise:
- Net sales: $734.384 million (up from $696.197 million for the same period of the previous year)
- Net sales increased by 5.4% over the last 12 months
- Cost of goods sold: $411.388 million (up from $386.239 million for the same period of the previous year)
- Cost of goods sold increased by 6.5% over the last 12 months
- Net income: $43.937 million (up from $37.268 million for the same period of the previous year)
- Diluted earnings per share: $0.97 (up from $0.79 for the same period of the previous year)
- PE ratio of Carter's Inc.: 24.2
- Dividend declared for the quarter: $0.50
- Dividend yield of Carter's Inc: 2.12%
- Diluted weighted-average shares outstanding: 45.038 million (down from 46.946 million for the same period of the previous year)
- Cash and cash equivalents: $118.458 million
- Cash and cash equivalents per share: $2.63
- Cash and cash equivalents makes up 2.79% of Carters' market capital
- Cash and cash equivalents makes up 4.3% of Carters' total assets
- Accounts receivable: $168.176 million
- Accounts receivable makes up 6.12% of Carters' total assets
- Goodwill of Carter's: $228.860 million
- Goodwill per share: $5.08
- Goodwill makes up 8.33% of Carters' total assets
- Stockholders equity in Carter's Inc.: $827.897 million
- Stockholders equity per share in Carter's: $18.38
- So Carter's Inc. is trading at 5.12 times its stockholders equity per share which is outside the expected range of between 2 and 4 most firms tend to trade at
- Cash generated from operations (for the 6 months): $104.465 million
- Cash generated from operations per share (for the 6 months): $2.31
Carter's Inc.'s management commentary on the results
ATLANTA--(BUSINESS WIRE)--Jul. 25, 2019-- Carter’s, Inc. (NYSE:CRI), the largest branded marketer in North America of apparel exclusively for babies and young children, today reported its second quarter fiscal 2019 results.
“We achieved our sales and earnings growth objectives in the second quarter,” said Michael D. Casey, Chairman and Chief Executive Officer. “Our growth was driven by our retail and wholesale businesses, and reflects good demand for our spring and summer product offerings. Given the strength of our product offerings and related marketing strategies, we are expecting good growth in the second half and reaffirming our sales and earnings growth objectives for 2019.”
2019 Business Outlook
For the third quarter of fiscal 2019, the Company projects net sales will increase approximately 1% compared to the third quarter of fiscal 2018 and adjusted diluted earnings per share will increase approximately 3% to 4% compared to adjusted diluted earnings per share of $1.61 in the third quarter of fiscal 2018.
For fiscal 2019, consistent with its previously-issued outlook, the Company projects net sales will increase approximately 1% to 2% compared to fiscal 2018 and adjusted diluted earnings per share will increase approximately 4% to 6% compared to adjusted diluted earnings per share of $6.29 in fiscal 2018. This fiscal 2019 adjusted earnings forecast excludes the following pre-tax items: 1) charges totaling $7.8 million related to early extinguishment of debt; 2) expenses of $1.6 million related to organizational restructuring; 3) a benefit of $2.1 million related to a favorable recovery in value of China-related inventories, and 4) a $0.7 million reversal of store restructuring costs previously recorded during the third quarter of fiscal 2017. The Company believes these non-GAAP measurements provide investors with a meaningful view of the Company’s core operating results, and are the same measurements used by the Company’s executive management to assess the Company’s performance.
Carter's Inc. (NYSE: CRI) stock price history
The image below, obtained from Google, shows the stock price history of Carter's Inc. over the last 5 years. And it's been a very volatile but overall positive time for Carter's Inc. stockholders. 5 years ago the stock was trading at around $77.30 a stock and its currently trading at $94.16 a stock. That's a very modest return of 21.8% returned to Carter's Inc. stockholders over the last 5 years. While the return of 21.8% is not to bad, the opportunity cost of holding Carter's Inc. stock instead of say Netflix that returned over 300% over a 5 year period becomes significant.
The stock of Carter's Inc. is trading at a little closer to its 52 week high of $109.71 than it is to its 52 week low of $75.66 which to us is a indication that the short term momentum and sentiment of Carter's Inc. stock is relatively positive at this point in time.
The stock of Carter's Inc. is trading at a little closer to its 52 week high of $109.71 than it is to its 52 week low of $75.66 which to us is a indication that the short term momentum and sentiment of Carter's Inc. stock is relatively positive at this point in time.
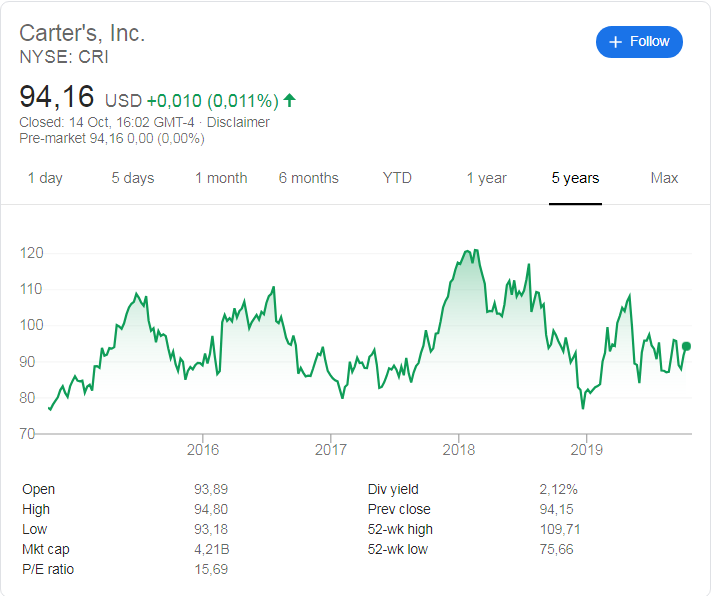
Carter's Inc. (NYSE: CRI) stock price history over the last 5 years
Recent coverage of Carter's Inc.
The extract below discusses why Carter's Inc. could potentially beat earnings estimates again as obtained from Zacks.com
Have you been searching for a stock that might be well-positioned to maintain its earnings-beat streak in its upcoming report? It is worth considering Carter's (CRI - Free Report) , which belongs to the Zacks Shoes and Retail Apparel industry. When looking at the last two reports, this maker of children's apparel and accessories has recorded a strong streak of surpassing earnings estimates. The company has topped estimates by 21.52%, on average, in the last two quarters. For the most recent quarter, Carter's was expected to post earnings of $0.80 per share, but it reported $0.95 per share instead, representing a surprise of 18.75%. For the previous quarter, the consensus estimate was $0.70 per share, while it actually produced $0.87 per share, a surprise of 24.29%.
Read the full article here
Carter's Inc. (NYSE: CRI) latest stock valuation
So what is Carter's Inc. stock worth based on the release of their latest earnings report and their outlook for the rest of their 2019 fiscal year? Based on Carter's Inc. latest earnings report and their outlook our valuation models provide a target (full value) price for Carter's Inc. stock at $100.60 a stock. We therefore believe that the stock of Carter's Inc. is undervalued.
We usually suggest that long term and fundamental investors get in at least 10% below our target (full value) price which in this case is $100.60 Therefore we believe a good entry point into Carter's Inc. stock is at $90.60 or below. We believe the release of Carter's Inc. 3rd quarter 2019 earnings report on the 23 October 2019 will provide guidance for the future direction of the stock price. And if there are no nasty surprises in their 3rd quarter 2019 earnings release, we expect the stock price of Carter's Inc. to tick upwards slightly to levels closer to our target (full value) price in coming weeks and months.
We usually suggest that long term and fundamental investors get in at least 10% below our target (full value) price which in this case is $100.60 Therefore we believe a good entry point into Carter's Inc. stock is at $90.60 or below. We believe the release of Carter's Inc. 3rd quarter 2019 earnings report on the 23 October 2019 will provide guidance for the future direction of the stock price. And if there are no nasty surprises in their 3rd quarter 2019 earnings release, we expect the stock price of Carter's Inc. to tick upwards slightly to levels closer to our target (full value) price in coming weeks and months.
Next earnings release date for Carter's Inc.
It is expected that Carter's Inc. (NYSE: CRI) 3rd quarter 2019 earnings report will be released on 23 October 2019.