
Overview of Conn's (CONN) earnings release for the 2nd quarter of their 2022 fiscal year
|
Category: Conn's (CONN)
Date: 7 September 2021 Stock Price of Conn's (CONN): $24.41 Market Capital of Conn's: $719.7 million We take a look at the 2nd quarter earnings report of their 2022 fiscal year of Conn's home plus, the specialty furniture and related accessories group. For the quarter the group reported revenues of $418.4 million and net income of $37million.
|
|
Strong second quarter retail and credit results exceeded our expectations and demonstrate that our growth strategies are taking hold. Second quarter same store sales increased 16.4% and total retail sales are up 24.0% over the prior year period. In fact, earnings per diluted share of $2.74 for the first six months of the year are higher than any annual earnings in Conn’s 131-year history - Chandra Holt, Conn’s Chief Executive Officer."
More About Conn's
We are a specialty retailer currently operating 128 retail locations in Alabama, Arizona, Colorado, Georgia, Louisiana, Mississippi, Nevada, New Mexico, North Carolina, Oklahoma, South Carolina, Tennessee, Texas and Virginia. We sell furniture and related accessories for the living room, dining room and bedroom, as well as traditional and specialty mattresses; home appliances, including refrigerators, freezers, washers, dryers, dishwashers and ranges; a variety of consumer electronics, including LED, OLED, Ultra HD and internet-ready televisions, Blu-ray players, home theater and portable audio equipment; and home office products, including computers, printers and accessories. We also offer a variety of products on a seasonal basis. Unlike many of our competitors, we provide flexible in-house credit options for our customers in addition to third-party financing programs and third-party lease-to-own payment plans.

Overview of Conn's 2nd quarter 2022 earnings report
Second Quarter Financial Highlights as Compared to the Prior Fiscal Year Period (Unless Otherwise Noted):
Second Quarter Results
Net income for the three months ended July 31, 2021 was $37.0 million, or $1.22 per diluted share, compared to net income for the three months ended July 31, 2020 of $20.5 million, or $0.70 per diluted share. On a non-GAAP basis, adjusted net income for the three months ended July 31, 2021 was $37.0 million, or $1.22 per diluted share. This compares to adjusted net income for the three months ended July 31, 2020 of $21.7 million, or $0.75 per diluted share, which excludes professional fees associated with non-recurring expenses.
Credit Segment Second Quarter Results
Credit revenues were $71.4 million for the three months ended July 31, 2021 compared to $87.0 million for the three months ended July 31, 2020, a decrease of $15.6 million or 17.9%. The decrease in credit revenue was primarily due to a 22.7% decrease in the average outstanding balance of the customer receivable portfolio. These decreases were partially offset by an increase in the yield rate, from 23.2% for the three months ended July 31, 2020 to 23.3% for the three months ended July 31, 2021 and an increase in insurance commissions.
Provision for bad debts was $10.1 million for the three months ended July 31, 2021 compared to $31.9 million for the three months ended July 31, 2020, a decrease of $21.8 million. The change was primarily driven by a year-over-year decrease in net charge-offs of $43.8 million, partially offset by a smaller decrease in the allowance for bad debts during the three months ended July 31, 2021 compared to the three months ended July 31, 2020. The smaller decrease was driven by a lower year-over-year decline in the customer accounts receivable portfolio balance, partially offset by a $5.0 million decrease in the economic adjustment that was driven by an improvement in the forecasted unemployment rate.
Credit segment operating income was $25.5 million for the three months ended July 31, 2021, compared to $18.2 million for the three months ended July 31, 2020. The increase was primarily due to the decrease in the provision for bad debts partially offset by the decrease in credit revenue.
- Net earnings increased to a second quarter record of $1.22 per diluted share, compared to $0.70 per diluted share for the same period last fiscal year;
- Same store sales increased 16.4% for the second quarter of fiscal year 2022 as compared to the second quarter of fiscal year 2021 and increased 3.2% on a two-year basis;
- Strong same store sales combined with the contribution of new showrooms drove a 24.0% increase in total retail sales for the second quarter;
- eCommerce sales increased 210.9% to a quarterly record of $17.3 million;
- Lease-to-own sales increased 70.3% to $41.6 million;
- At July 31, 2021, the carrying value of customer accounts receivable 60+ days past due declined 42.1% year-over-year to the lowest level in eight fiscal years, and the carrying value of re-aged accounts declined 44.5% year-over-year to the lowest level in six fiscal years; and
- Total debt decreased from $749.7 million at July 31, 2020 to $439.6 million at July 31, 2021, a decrease of 41%. Net debt as a percent of the portfolio balance at July 31, 2021, was approximately 36%, compared to 50% at July 31, 2020, and represents the lowest level in over a decade.
Second Quarter Results
Net income for the three months ended July 31, 2021 was $37.0 million, or $1.22 per diluted share, compared to net income for the three months ended July 31, 2020 of $20.5 million, or $0.70 per diluted share. On a non-GAAP basis, adjusted net income for the three months ended July 31, 2021 was $37.0 million, or $1.22 per diluted share. This compares to adjusted net income for the three months ended July 31, 2020 of $21.7 million, or $0.75 per diluted share, which excludes professional fees associated with non-recurring expenses.
Credit Segment Second Quarter Results
Credit revenues were $71.4 million for the three months ended July 31, 2021 compared to $87.0 million for the three months ended July 31, 2020, a decrease of $15.6 million or 17.9%. The decrease in credit revenue was primarily due to a 22.7% decrease in the average outstanding balance of the customer receivable portfolio. These decreases were partially offset by an increase in the yield rate, from 23.2% for the three months ended July 31, 2020 to 23.3% for the three months ended July 31, 2021 and an increase in insurance commissions.
Provision for bad debts was $10.1 million for the three months ended July 31, 2021 compared to $31.9 million for the three months ended July 31, 2020, a decrease of $21.8 million. The change was primarily driven by a year-over-year decrease in net charge-offs of $43.8 million, partially offset by a smaller decrease in the allowance for bad debts during the three months ended July 31, 2021 compared to the three months ended July 31, 2020. The smaller decrease was driven by a lower year-over-year decline in the customer accounts receivable portfolio balance, partially offset by a $5.0 million decrease in the economic adjustment that was driven by an improvement in the forecasted unemployment rate.
Credit segment operating income was $25.5 million for the three months ended July 31, 2021, compared to $18.2 million for the three months ended July 31, 2020. The increase was primarily due to the decrease in the provision for bad debts partially offset by the decrease in credit revenue.
Conn's management commentary on their 2nd quarter 2022 earnings
THE WOODLANDS, Texas, Sept. 01, 2021 (GLOBE NEWSWIRE) -- Conn’s, Inc. (NASDAQ: CONN) (“Conn’s” or the “Company”), a specialty retailer of furniture and mattresses, home appliances, consumer electronics and home office products, and provider of consumer credit, today announced its financial results for the quarter ended July 31, 2021.
“Strong second quarter retail and credit results exceeded our expectations and demonstrate that our growth strategies are taking hold. Second quarter same store sales increased 16.4% and total retail sales are up 24.0% over the prior year period. Strong retail performance combined with a second quarter credit spread of 1,200 basis points, contributed to record second quarter earnings per diluted share. In fact, earnings per diluted share of $2.74 for the first six months of the year are higher than any annual earnings in Conn’s 131-year history,” stated Chandra Holt, Conn’s Chief Executive Officer.
“Momentum remains positive across our business reflecting strong consumer demand and the growth strategies we have put in place. Total retail sales for the first half have increased at the fastest growth rate in seven years. As a result, we are increasing our fiscal year 2022 same store sales expectation from high single-digit same store sales growth to mid-teens same store sales growth,” continued Ms. Holt.
“I believe Conn’s is well positioned to continue to innovate, grow and capitalize on an enormous addressable market. As my tenure as CEO begins, I am excited by the direction Conn’s is headed and the opportunities we have to create sustainable value for our shareholders. I also want to thank all our team members for their contributions to our success and their continued dedication,” concluded Ms. Holt.
Showroom and Facilities Update
The Company opened three new Conn’s HomePlus® showrooms during the second quarter of fiscal year 2022, all within the state of Florida, bringing the total showroom count to 155 in 15 states. During fiscal year 2022, the Company plans to open a total of eleven to thirteen new showrooms (inclusive of the nine new showrooms opened during the first half of fiscal year 2022).
Liquidity and Capital Resources
As of July 31, 2021, the Company had $362.9 million of immediately available borrowing capacity under its $650.0 million revolving credit facility. The Company also had $8.7 million of unrestricted cash available for use.
Conn's (CONN) stock price chart over the last 5 years
The image below shows the stock price history of Conn's over the last 5 years. And its been a very good time for Conn's stockholders with the stock price increasing by a whopping 137.2% over a 5 year period.
The stock of Conn's is trading a lot closer to its 52 week high than it is to its 52 week low which to us is a clear indication that the short term sentiment and momentum of Conn's stock is very positive at this point in time.
The stock of Conn's is trading a lot closer to its 52 week high than it is to its 52 week low which to us is a clear indication that the short term sentiment and momentum of Conn's stock is very positive at this point in time.
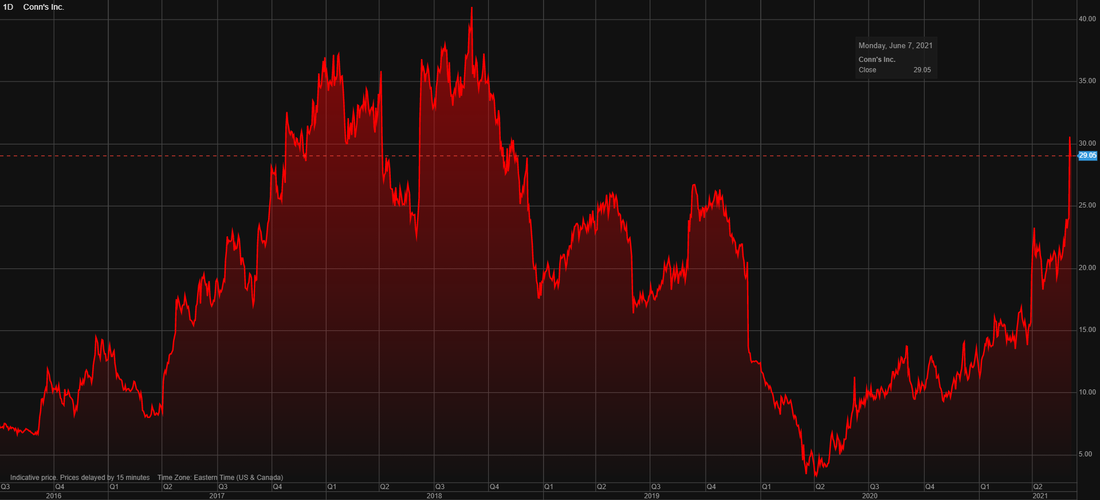
Conn's (NASDAQ: CONN) stock price history over the last 5 years
Conn's (CONN) vs Bed Bath and Beyond (BBBY) stock chart over the last 5 years
The image below shows the stock price performance of Conn's (CONN) and Bed Bath and Beyond over the last 5 years. Both are retailers of a wide variety of goods and hence the comparison. The summary below shows the stock price returns of Conn's and Bed Bath and Beyond (sorted from best to worst performer)
The stock of Conn's has easily outperformed that of Bed Bath and Beyond over the last 5 years.
- Conns (CONN): 137.2%
- Bed Bath and Beyond (BBBY): -41.4%
The stock of Conn's has easily outperformed that of Bed Bath and Beyond over the last 5 years.
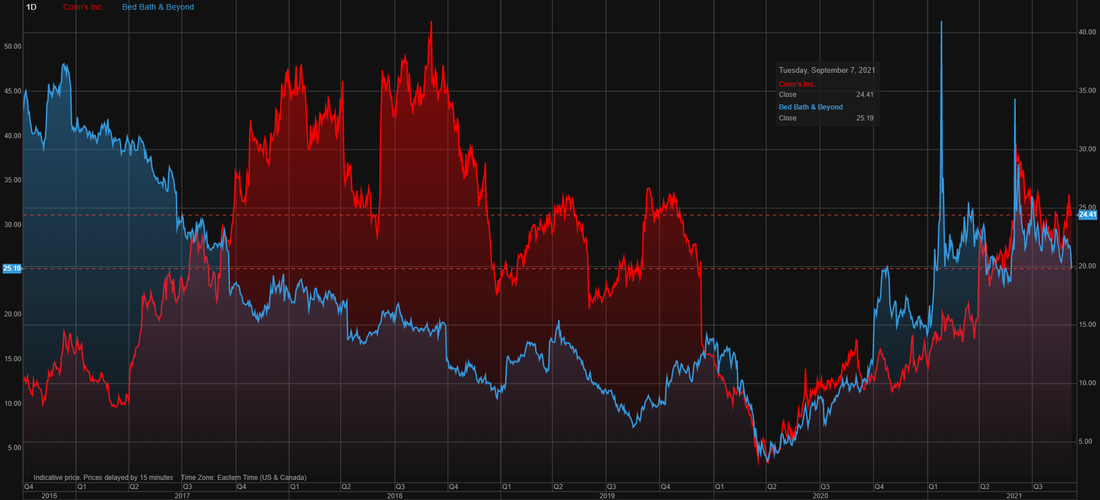
Conn's (CONN) vs Bed Bath and Beyond (BBBY) stock chart over the last 5 years
Conn's (CONN) latest stock valuation
So based on Conn's 2nd quarter 2022 earnings report what do we value their stock at? Based on their latest earnings report our valuation model provides a target price for the stock of Conn's (CONN) at $27.40 a stock
We therefore believe the stock of Conn's is slightly undervalued at its current price of $24.41. We recommend that investors look to enter a stock at least 10% below our target price which in this case is $27.40. A good entry point into the stock of Conn's would therefore be at $24.60 or below.
We expect the stock of Conn's to kick up slightly to levels closer to our target price in coming weeks and months. We rate the stock of Conn's (CONN) as a hold
Next earnings release of Conn's (CONN)
It is expected that Conn's will release their 2nd quarter 2022 earnings report in early December 2021