
|
Related Topics
|
|
Category: Constellation Brands (STZ) and Technical Analysis
Date: 14 July 2020 Stock Price of Constellation Brands: $179.69 The stock price of Constellation Brands (STZ) has increased by 44.92% over the last 5 years. A decent return provided to stockholders. The question is what is next for Constellation Brands (STZ) stock? Where is it heading over the short and longer term?
|

|
While over the 5 year period the stock of Constellation Brands increased by a decent 44.9%. The question is where to from here for the stock of Constellation Brands (STZ)? Below we do some technical analysis on Constellation Brands' stock price in order to determine the most likely route STZ stock is to take in coming weeks and months."
More About Constellation Brands (STZ)
Constellation Brands (NYSE: STZ and STZ.B), a Fortune 500® company, is a leading international producer and marketer of beer, wine and spirits with operations in the U.S., Mexico, New Zealand, Italy, and Canada. Constellation is the No. 3 beer company in the U.S. with high-end, iconic imported beer brands such as the Corona and Modelo brand families, and Pacifico. Its high-quality wine and spirits brands include the Robert Mondavi and The Prisoner Wine Company brand families, Kim Crawford, Ruffino, Meiomi, and SVEDKA Vodka. The company’s portfolio also includes a collection of highly-rated wine brands such as SIMI and Mount Veeder Winery, spirits brands High West Whiskey and Casa Noble Tequila, as well as new wine innovations such as Cooper & Thief and Spoken Barrel.
Based in Victor, N.Y., the company believes that industry leadership involves a commitment to brand building, our trade partners, the environment, our investors, and to consumers around the world who choose our products when celebrating big moments or enjoying quiet ones. Since its founding in 1945, Constellation’s ability to see, meet and stay ahead of shifting consumer preferences and trends across total beverage alcohol has fueled our success and made us one of the top growth contributors in beverage alcohol in the U.S.
In the beer business, we have solidified our position in the U.S. beer market; enhanced our margins, results of operations and operating cash flow; and provided new avenues for growth. We have made capital investments and acquisitions to increase beer production capacity to secure independence from a supply standpoint and to support the growth of the business. Additionally, in an effort to more fully compete in growing sectors of the highend segment of the U.S. beer market, we’ve made several acquisitions of high-quality, regional craft beer brands and leveraged our innovation capabilities to introduce new brands that align with consumer trends.
In our wine and spirits business, as part of our efforts to focus on higher-end brands, improve margins and create operating efficiencies, we have acquired higher-margin, higher-growth wine brands and portfolios of brands, including Meiomi, Prisoner and Charles Smith, and have strategically optimized the value of this business, particularly lower-margin, lower-growth products, with the divestiture of the Canadian wine business and the expected transaction, which was recently announced, to divest a portion of our wine and spirits business. In addition, we have added higher-end brands to our spirits portfolio through the acquisitions of Casa Noble tequila and High West craft whiskeys.
The summary below shows the sales mix of Constellation Brands. It shows the sales values in Dollar millions as well as the relative contribution to total sales for Constellation Brands:
- Beer: 5,202.1 (64.1%)
- Wine: 2,532.5 (31.2%)
- Spirits: 381.4 (4.7%)
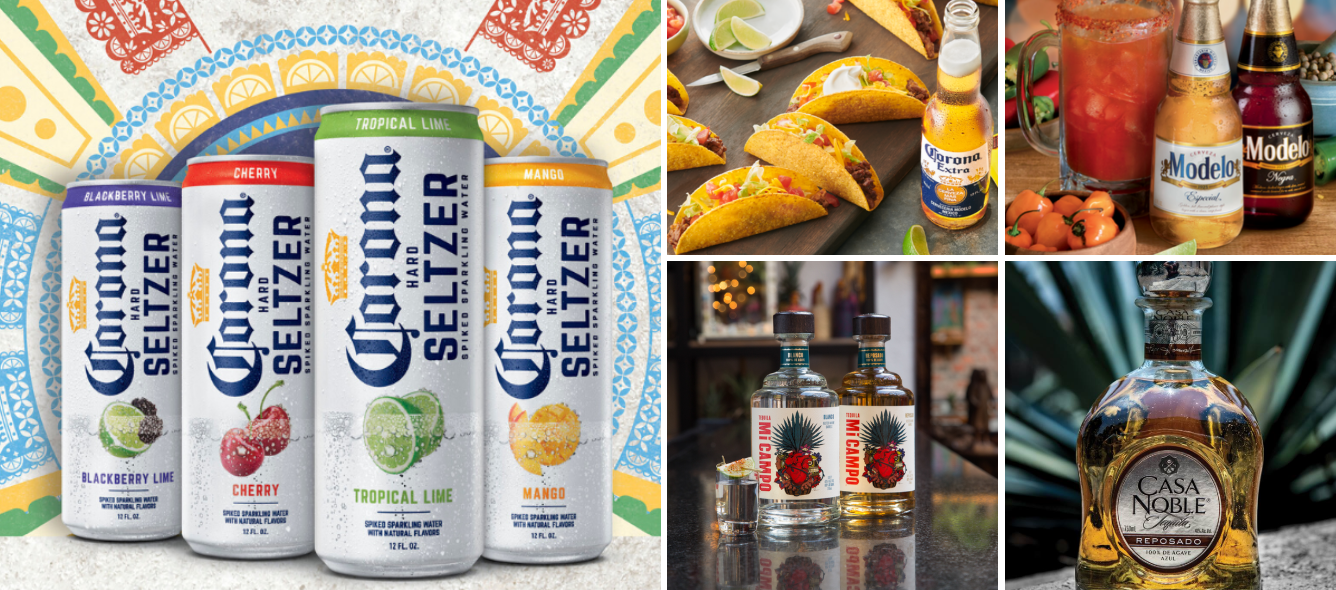
Constellation Brands portfolio includes Corona and Modelo Beer
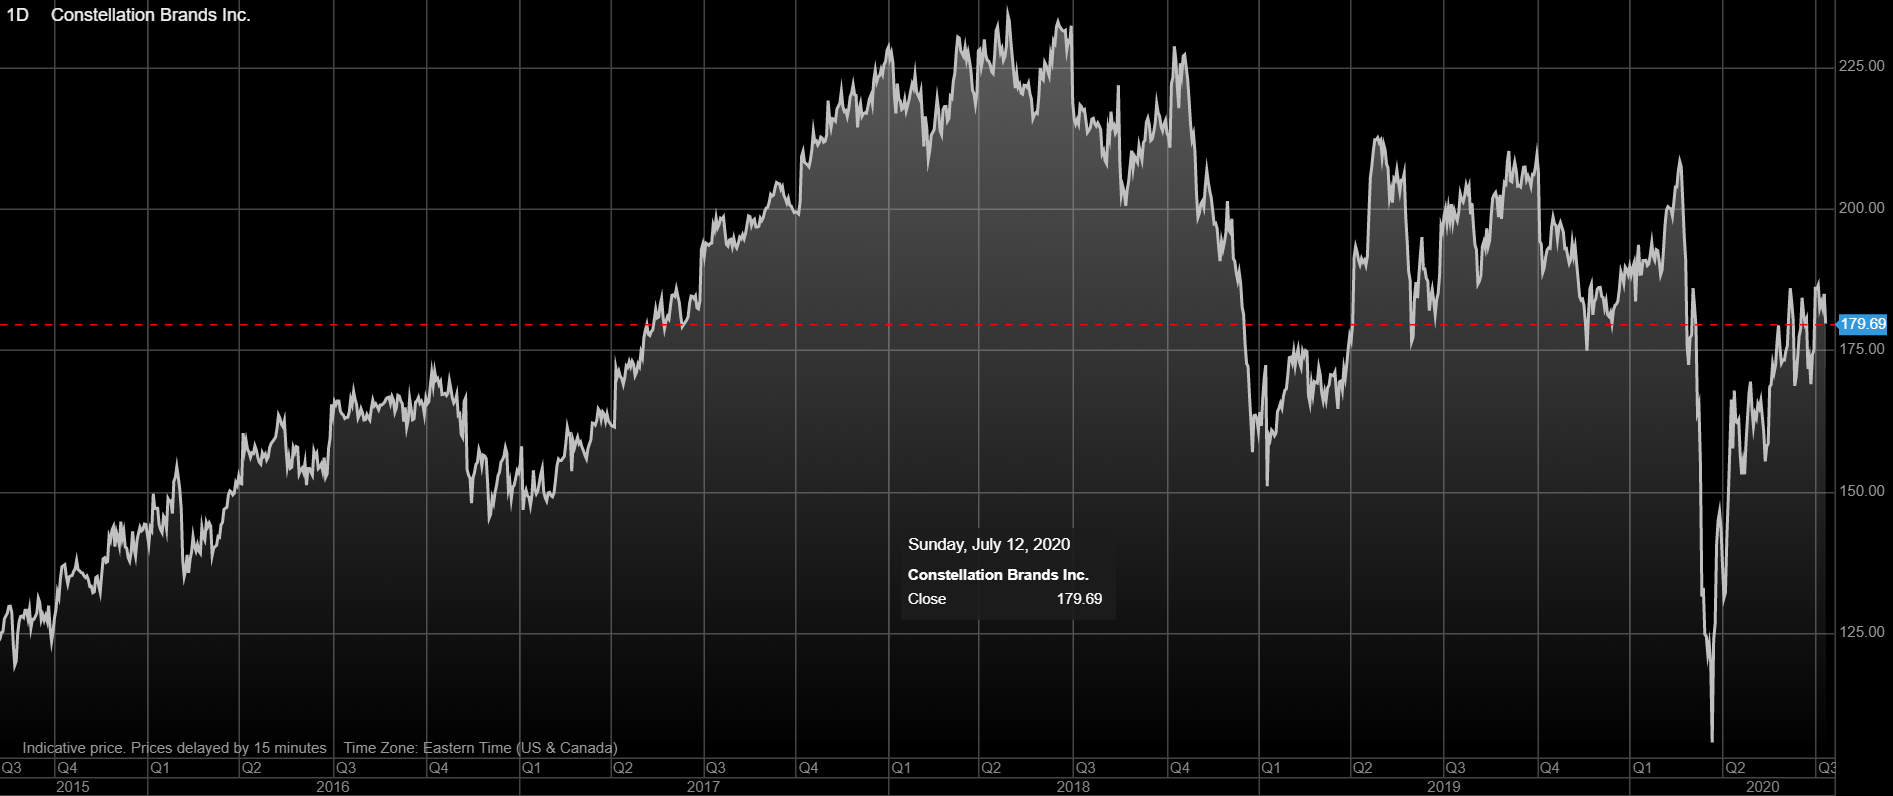
Constellation Brands (STZ) stock price history over the last 5 years
The image below shows the stock price history of Constellation Brands over the last 5 years. And its been decent time for Constellation Brands stockholders with the stock of Constellation Brands increasing by 44.9% over the last 5 years
Constellation Brands (STZ) stock price history over the last 5 years
While over the 5 year period the stock of Constellation Brands increased by a decent 44.9%. The question is where to from here for the stock of Constellation Brands (STZ)? Below we do some technical analysis on Constellation Brands' stock price in order to determine the most likely route STZ stock is to take in coming weeks and months.
Technical Analysis of Constellation Brands (STZ) stock price
While there are many different technical analysis indicators we tend to follow the principle of keeping things simple. The KIS principle. So we will take a look at the shorter term moving averages and the longer term moving averages as well as the Relative Strength Index (RSI). So let's focus at the longer term moving averages first. The image below shows the stock price of Constellation Brands (STZ) as well as its 50 day and 200 day moving average as well as the RSI for Constellation Brands

Constellation Brands (STZ) stock price with its 50 and 200 day moving average and RSI
From the image above, one can see that the RSI is above the midpoint of 50, but below the 70 mark, which is an indicator of a stock being overbought (basically it is due for a correction). So the RSI is not providing a definitive sign of where the stock is heading, but since it touched 70 relatively recently and has pulled back from there we believe the stock of Constellation Brands is in a correction phase right now which could signal further stock price weakness in coming weeks.
Turning our attention to the moving averages one can see the 50 day moving average is well below the 200 day moving average (which is a negative sign for a company's stock price). If the 50 day moving average crosses below the 200 day moving average it is a negative sign and indicates potential stock declines, if the 50 day crosses above the 200 day moving average its a positive sign for a company's stock price.
From the image above one can see the 50 day moving average is well below the 200 day moving average, which is a negative sign. But since the RSI has been coming down recently and its pointing to a potential further decline in the stock of Constellation the question is how far will it fall, if it falls? The 50 day moving average and 200 day moving average also shows medium and long term support levels for a stock price. So should STZ stock decline more it is expected to find medium and longer term support at the following prices:
As we mentioned 50 day and 200 day moving averages are longer term technical indicators, so let's take a look at shorter term indicators. The image below shows the stock price of Constellation Brands (STZ) as well as its 10 day and 30 day moving average as well as the RSI for Constellation Brands.
Turning our attention to the moving averages one can see the 50 day moving average is well below the 200 day moving average (which is a negative sign for a company's stock price). If the 50 day moving average crosses below the 200 day moving average it is a negative sign and indicates potential stock declines, if the 50 day crosses above the 200 day moving average its a positive sign for a company's stock price.
From the image above one can see the 50 day moving average is well below the 200 day moving average, which is a negative sign. But since the RSI has been coming down recently and its pointing to a potential further decline in the stock of Constellation the question is how far will it fall, if it falls? The 50 day moving average and 200 day moving average also shows medium and long term support levels for a stock price. So should STZ stock decline more it is expected to find medium and longer term support at the following prices:
- 50 day moving average: $173.89
- 200 day moving average : $178.05
As we mentioned 50 day and 200 day moving averages are longer term technical indicators, so let's take a look at shorter term indicators. The image below shows the stock price of Constellation Brands (STZ) as well as its 10 day and 30 day moving average as well as the RSI for Constellation Brands.
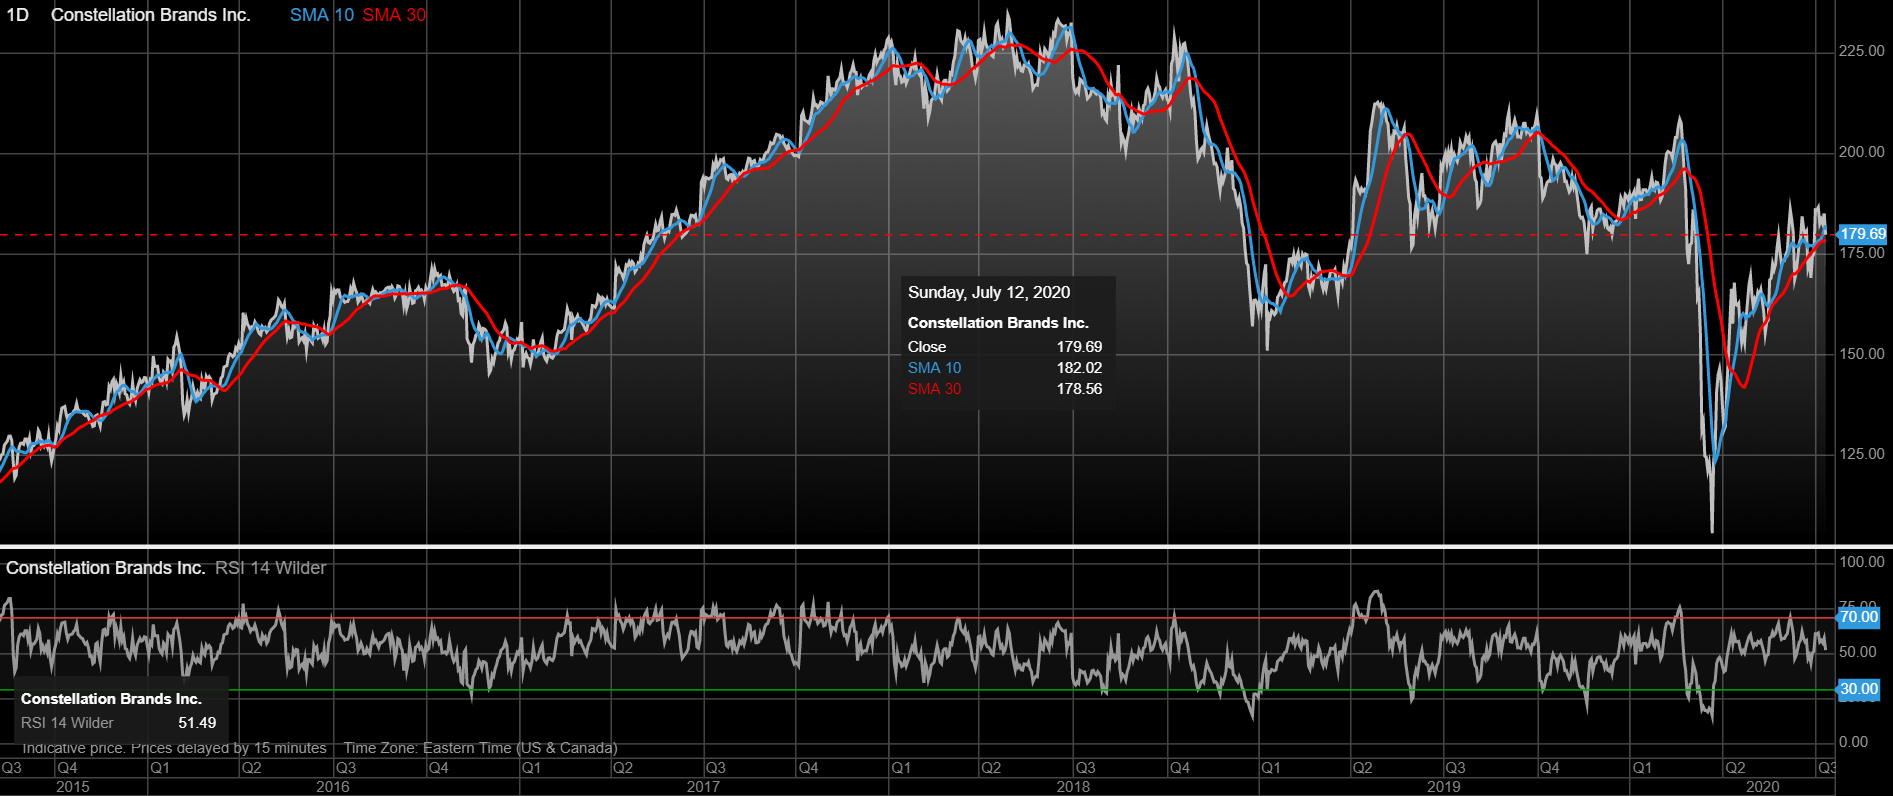
Constellation Brands (STZ) stock price with its 10 and 30 day moving average and RSI
In a similar vein to the approach to the longer term analysis, if the 10 day moving averages crosses over above the 30 day moving average it is a positive sign for a stock and if the 10 day moving average crosses below the 30 day moving average its a negative sign for a stock price. At this point the 10 day moving average is trading at just above the 30 day moving average (a positive sign). But since the RSI is indicating potential further declines the question is over the shorter term period where are the support levels for Constellation Brands' stock price?
So should Constellation Brands (STZ) stock be in for a correction as the RSI indicates, the first support levels will be the shorter term levels shown above. If the stock falls below these support levels the next support levels will be the 50 day and 200 day moving average levels.
Thus if the stock of Constellation Brands (STZ) decides today to start its decline we will see the following levels as support levels for Constellation Brands
- 10 day moving average: $182.02
- 30 day moving average: $178.56
- 50 day moving average: $173.89
- 200 day moving average : $178.05