|
Related Topics
|
|
Category: Stock Market and Dycom
Date: 29 August 2019 Stock Price: $44.47 We take a look at the 2nd quarter earnings (ended July 2019) report of Dycom, the network infrastructure for their 2019 fiscal year. Has the continued demand for faster and more broadband benefited the group?
|
|
About Dycom Industries
We collaborate with customers to design and deploy scalable network infrastructure to meet the exploding demand for ultra-fast broadband. Dycom offers a comprehensive portfolio of specialty services including end to end project management and maintenance.
Financial overview of Dycom's latest earnings report
Numbers we are interested in: (for the quarter):
- Contract revenues: $884.221 million (up from $799.470 million for the same quarter of the previous year)
- Net income: $29,896 (down from $29,900)
- Diluted earnings per common share: $0.94 (unchanged from $0.94 )
- Diluted number of shares in issue: 31.820 million
- Cash and equivalents: $12.583 million
- Cash and equivalents per share: $0.395
- Cash and equivalents per share makes up 0.89% of the current stock price
- Accounts receivable, net: $796.908 million
- Accounts receivable makes up 34.2% of the group's total assets (for us a worrying level is anything above 20%)
- Accounts receivable made up 29.8% of the group's total assets as at end January 2019. So there has been a marked increase in the contribution of account receivables to total assets.
- Total stockholders' equity: $853.433 million
- Stockholders equity per share: $26.82
- Cash generated from operations: $12.6 million
- Cash generated from operations per share: $0.39
Dycom's management commentary on the results and earnings guidance
PALM BEACH GARDENS, Fla., Aug. 28, 2019 /PRNewswire/ -- Dycom Industries, Inc. (NYSE: DY) announced today its results for the second quarter and six months ended July 27, 2019. The Company reported:
Outlook
The Company also announced its outlook for the fiscal quarter ending October 26, 2019. The Company currently expects total contract revenues for the fiscal quarter ending October 26, 2019 to range from $820 million to $870 million. On a GAAP basis, diluted earnings per common share for the fiscal quarter ending October 26, 2019 is expected to range from $0.48 to $0.68 and Non-GAAP Adjusted Diluted Earnings per Common Share is expected to range from $0.60 to $0.80. Non-GAAP Adjusted Diluted Earnings per Common Share guidance excludes $5.1 million of pre-tax interest expense, or $0.12 per common diluted share on an after-tax basis, for the non‑cash amortization of the debt discount associated with the Company's 0.75% convertible senior notes due September 2021 (the "Notes").
- Contract revenues of $884.2 million for the quarter ended July 27, 2019, compared to $799.5 million for the quarter ended July 28, 2018. Contract revenues for the quarter ended July 27, 2019 increased 11.1% on an organic basis after excluding $3.8 million in contract revenues from storm restoration services for the quarter ended July 28, 2018.
- Non-GAAP Adjusted EBITDA of $100.2 million, or 11.3% of contract revenues, for the quarter ended July 27, 2019, compared to Non-GAAP Adjusted EBITDA of $97.8 million, or 12.2% of contract revenues, for the quarter ended July 28, 2018.
- On a GAAP basis, net income was $29.9 million, or $0.94 per common share diluted, for each of the quarters ended July 27, 2019 and July 28, 2018. Non-GAAP Adjusted Net Income was $34.6 million, or $1.09 per common share diluted, for the quarter ended July 27, 2019, compared to Non-GAAP Adjusted Net Income of $33.3 million, or $1.05per Non-GAAP Adjusted Diluted Share, for the quarter ended July 28, 2018.
- The Company entered into a contract modification that increases revenue produced by a large customer program. As a result, the Company recognized $11.8 million of contract revenues for services performed in prior periods and $1.8 million of related performance-based compensation expense. On an after-tax basis, these items contributed approximately $7.3 million to net income, or $0.23 per common share diluted, for the quarter ended July 27, 2019.
- Contract revenues of $1.718 billion for the six months ended July 27, 2019, compared to $1.531 billion for the six months ended July 28, 2018. Contract revenues for the six months ended July 27, 2019 increased 13.5% on an organic basis after excluding contract revenues from an acquired business that was not owned for the full period in both the current and prior year periods and contract revenues from storm restoration services. Contract revenues from that acquired business were $13.4 million for the six months ended July 27, 2019 compared to $14.9 million for the six months ended July 28, 2018. Contract revenues from storm restoration services were $4.7 million for the six months ended July 27, 2019 compared to $18.6 million for the six months ended July 28, 2018.
- Non-GAAP Adjusted EBITDA of $173.8 million, or 10.1% of contract revenues, for the six months ended July 27, 2019, compared to Non-GAAP Adjusted EBITDA of $171.5 million, or 11.2% of contract revenues, for the six months ended July 28, 2018.
- On a GAAP basis, net income was $44.2 million, or $1.39 per common share diluted, for the six months ended July 27, 2019, compared to net income of $47.1 million, or $1.46 per common share diluted, for the six months ended July 28, 2018. Non-GAAP Adjusted Net Income was $51.6 million, or $1.62 per common share diluted, for the six months ended July 27, 2019, compared to Non-GAAP Adjusted Net Income of $54.0 million, or $1.70 per Non-GAAP Adjusted Diluted Share, for the six months ended July 28, 2018.
Outlook
The Company also announced its outlook for the fiscal quarter ending October 26, 2019. The Company currently expects total contract revenues for the fiscal quarter ending October 26, 2019 to range from $820 million to $870 million. On a GAAP basis, diluted earnings per common share for the fiscal quarter ending October 26, 2019 is expected to range from $0.48 to $0.68 and Non-GAAP Adjusted Diluted Earnings per Common Share is expected to range from $0.60 to $0.80. Non-GAAP Adjusted Diluted Earnings per Common Share guidance excludes $5.1 million of pre-tax interest expense, or $0.12 per common diluted share on an after-tax basis, for the non‑cash amortization of the debt discount associated with the Company's 0.75% convertible senior notes due September 2021 (the "Notes").
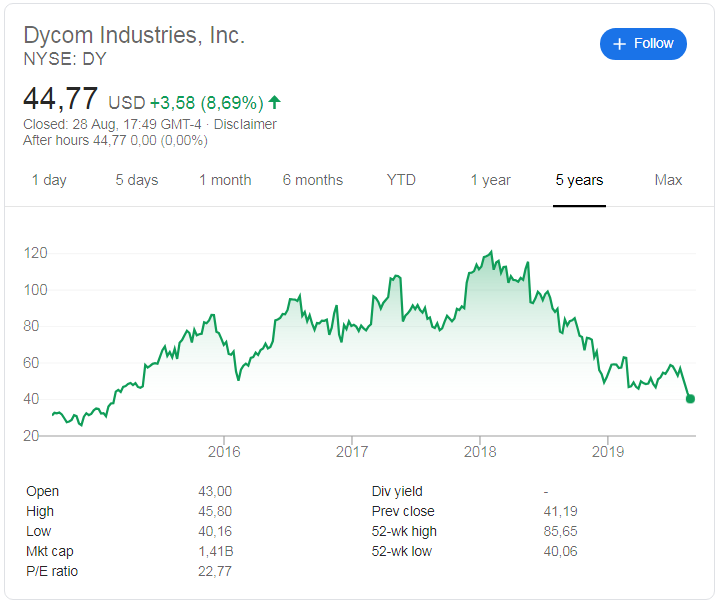
Dycom Industries (NYSE: DY) stock price history
.The image below, obtained from Google, shows that the Dycom stock price had a pretty wild ride over the last 5 years. With it trading at $31 a share in late 2015, and reaching levels of over $120 a share in early 2018. And since then its been a constant decline in the stock price of Dycom to the current levels of around $44.70 a share.
Dycom Industries (NYSE: DY) latest stock valuation
Based on the group's latest earnings and the broad guidance provided we value Dycom shares at $40.02 a share. And this takes into account pretty aggressive earnings growth over the next few years considering the market and industry they operate in.Should they not meet those growth rates the market will surely re rate the stock and price weakness can be expected. And based on our target price for Dycom we can understand why the stock price has declined from levels of over $120 a share recorded in 2018.