|
Related Topics
|
|
Category: Stock Market and Francesca's
Date: 10 September 2019 Stock Price: $5.16 We take a look at the 2nd quarter earnings release of their 2019 fiscal year of Francesca's, the specialty retailer which has seen its stock price decline from over $200 a stock to the current $5 in just a few short years.
|

|
About Francesca's
francesca’s is one of the fastest growing specialty retailers in the United States.Our retail locations are designed and merchandised to feel like independently owned, upscale boutiques and provide our customers with an inviting, intimate and differentiated shopping experience. We believe we offer compelling value with a diverse and uniquely balanced mix of high-quality, trend-right apparel, jewelry, accessories and gifts at attractive prices. We tailor our assortment to appeal to our core 18-35 year-old, fashion conscious, female customer, although we find that women of all ages are attracted to our eclectic and sophisticated merchandise selection and boutique setting. We carry a broad selection but limited quantities of individual styles and introduce new merchandise to our boutiques five days a week to create a sense of scarcity and newness, which helps drive customer shopping frequency and loyalty. Our boutiques have been successful across a wide variety of geographic markets and shopping venues. We believe we have an opportunity to continue to grow our boutique base to approximately 900 boutiques in the United States
Financial overview of Francesca's latest earnings report
The numbers we are interested in (for the quarter):
- Net sales $105.972 million (down from $113.025 million from the same quarter of the previous year)
- Cost of sales: $65.469 million (down from $68.918 million for the same quarter of the previous year)
- Net income: $1.812 million (down from from $454 thousand for the same quarter of the previous year)
- Diluted earnings per share: $0.61 (up from $0.16 for the same quarter of the previous year)
- Diluted weighted-average shares outstanding: 2.96 million (up from 2.918 million for the same quarter of the previous year)
- PE ratio: 2.2 (based on the earnings per share for the current quarter being reported for full fiscal year)
- Cash and cash equivalents: $21.962 million
- Cash and cash equivalents per share: $7.41
- Cash and cash equivalents makes up 143% of Francesca's market capital
- Cash and cash equivalents makes up 5.97% of Francesca's total assets
- Inventories: $30.942 million (down from $31.902 million for the same quarter of the previous year)
- Inventories makes up 8.41% of Francesca's total assets
- Inventories declined by -3% over the last year
- Accounts receivable: $7.987 million (down from $19.764 million for the same quarter of the previous year)
- Accounts receivable makes up 2.16% of Francesca's total assets
- Accounts receivable declined sharply by -59% over the last year
- Total shareholders' equity of Francesca's: $62.977 million
- Shareholders' equity per share: $21.27
- So Francesca's is trading at 0.24 times the stockholders equity per share
Francesca's management commentary on the results and earnings guidance
HOUSTON, Sept. 10, 2019 (GLOBE NEWSWIRE) -- Francesca’s Holdings Corporation (Nasdaq: FRAN) today reported financial results for the second quarter ended August 3, 2019.
Michael Prendergast, Interim CEO, stated, “We are very pleased to see significant improvement in our comparable sales for the second quarter. After a long period of double digit comp sales declines we achieved considerable sequential improvement in our comp sales in each month within the quarter. Gross margin was impacted by aggressive markdowns on poor performing legacy products that we accelerated within the quarter. However, we saw strong and better than expected sell through on new merchandise. Our merchant teams have done an excellent job of shifting back to a “read and react” buying and planning strategy, resulting in more nimble buying and planning processes. We believe effective implementation of this data analytic and customer demand strategy is driving a meaningful improvement in both boutique traffic and conversion during the second quarter. We realized material savings this quarter through a number of cost reduction initiatives that we have been executing since the beginning of fiscal 2019. In addition, we continue to make headway in optimizing our real estate portfolio. We are extremely pleased with our progress, which we believe is validating our go-forward turnaround strategy and look forward to driving continued positive momentum in the business.”
SECOND QUARTER RESULTS
Net sales decreased 6% to $106.0 million from $113.0 million in the comparable prior year quarter due to a 5% decrease in comparable sales. The decrease in comparable sales was the result of lower average unit retail prices associated with deeper markdowns on legacy product. This decrease was partially offset by higher boutique conversion rates and higher average units per transaction. The Company opened one new boutique and closed five boutiques during the second quarter, bringing its total boutique count to 718 at the end of the quarter.
Gross profit, as a percent of net sales, decreased to 38.2% from 39.0% in the prior year quarter. This unfavorable variance was due to lower merchandise margins as a result of deeper markdowns on legacy product and deleveraging of occupancy costs as a result of lower sales.
Selling, general and administrative (SG&A) expenses decreased 10% to $39.1 million from $43.3 million in the prior year quarter. Adjusted SG&A in the second quarter of fiscal 2019 was $38.7 million and excludes $0.5 million in other payroll costs associated with the Company’s turnaround plan, $0.3 million of professional fees incurred in connection with the Company’s previously announced reverse stock split and adoption of a shareholder rights plan, and $0.3 million of stock-based compensation reversal associated with the departure of the Company’s former Chief Financial Officer. There were no non-GAAP adjustments for SG&A in the second quarter of fiscal 2018.
The $4.6 million decrease in adjusted SG&A in the second quarter of fiscal year 2019 versus the comparable prior year period was primarily due to a $2.5 million decrease in boutique payroll and supplies associated with the Company’s cost reduction initiatives under the turnaround plan. Additionally, corporate payroll and related expenses decreased $0.9 million primarily due to the lower headcount as a result of the February 2019 workforce reduction, marketing expenses decreased $0.4 million, and asset write-off charges related to boutique remodels decreased $0.3 million.
Income from operations was $1.4 million compared to $0.8 million in the prior year quarter. Excluding the adjustments noted above for adjusted SG&A, adjusted income from operations in the second quarter of fiscal year 2019 was $1.8 million. There were no non-GAAP adjustments for income from operations in the second quarter of fiscal 2018.
The Company’s income tax benefit was $0.3 million in the second quarter of this year compared to an income tax expense of $0.4 million in the comparable prior year quarter. The income tax benefit recognized in the second quarter was based on the Company’s revised estimate of its annualized taxable income for fiscal year 2019.
Net income for the second quarter was $1.8 million, or $0.61 diluted earnings per share, compared to $0.5 million, or $0.16 diluted earnings per share, in the prior year quarter. Adjusted net income for the second quarter of fiscal year 2019 was $2.1 million, or $0.72 adjusted diluted earnings per share. There were no non-GAAP adjustments for net income or diluted earnings per share in the second quarter of fiscal 2018.
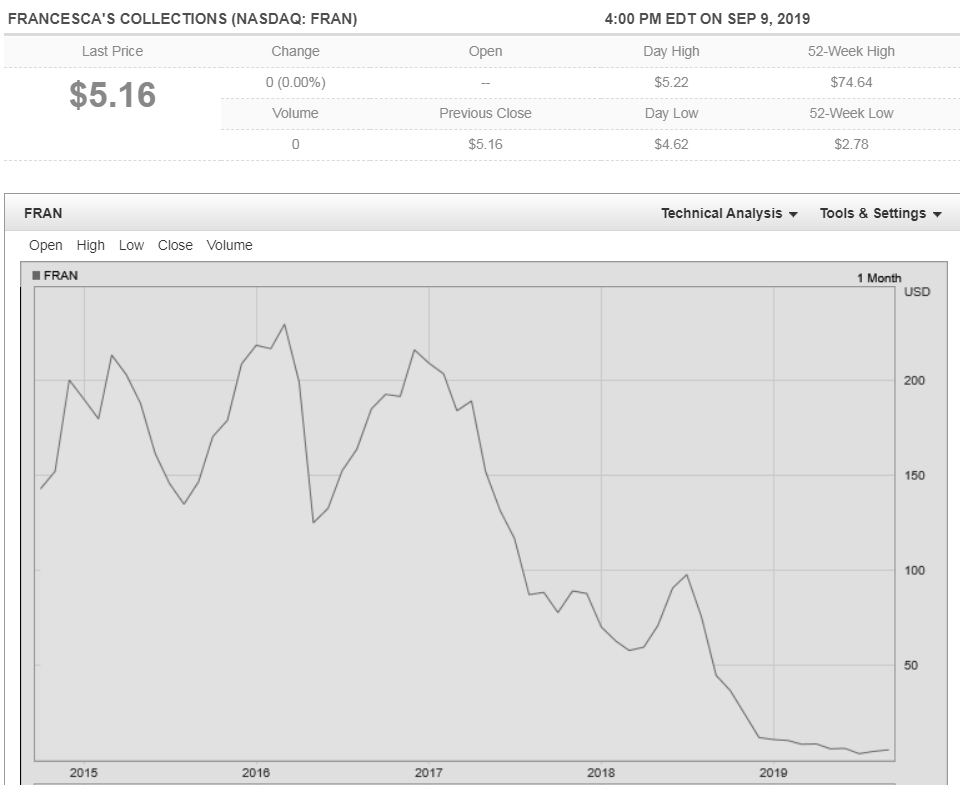
Francesca's (NASDAQ: FRAN) stock price history
The image below shows the stock price history of Francesca's over the last 5 years, and its been an absolute horror show for Francesca's investors. 5 years ago the stock traded at around $150 and it hit highs of well over $200. But since the middle of 2017 its been a long continuous decline in the stock price of the group to the current levels of $5.16 The stock is trading at a lot closer to its 52 week low of $2.78 than it is to its 52 week high of $74.64, just showing how negative the sentiment and momentum of Francesca stock is.
Francesca's (NASDAQ: FRAN) latest stock valuation
So what is Francesca's stock worth after the release of their latest earnings report? Is the market justified in punishing the group's stock price so hard? It is not often that a stock trades at a quarter of its stockholders equity per share. Or where a group's cash on their balance sheet is more than the market capital. But that is exactly what is happening to Francesca.
It's cash per share is 43% higher than the current stock price
Its stockholders equity per share ($21.27) is more than 4 times the stock price ($5.16)
This tells us that the sell off in Francesca's stock price has been overdone. As a minimum we would expect the group to trade at parity with its stockholders equity per share of $21.27. Based on the group's earnings release and their improved net income per share, our valuation model has a target (full value) price for Francesca's stock of $39.20. We therefore believe the stock price is undervalued and expect the stock to recover in coming weeks and months to levels a lot closer if not past our target price for the group.