
Honeywell (HON) earnings release overview for the 2nd quarter of their 2021 fiscal year
|
Category: Honeywell (HON)
Date: 26 July 2021 Stock Price of Honeywell (HON): $229.32 Market Capital of Honeywell (HON): $159.3 billion We take a look at the 2nd quarter earnings release of their 2021 fiscal year of Honeywell, a Fortune 100 technology company active in various industries including aerospace, manufacturing plants and supply chains. For the quarter the group reported revenues of $8.08 billion and net income of $1.447 billion.
|
|
About Honeywell
Honeywell (www.honeywell.com) is a Fortune 100 technology company that delivers industry specific solutions that include aerospace products and services; control technologies for buildings and industry; and performance materials globally. Our technologies help everything from aircraft, buildings, manufacturing plants, supply chains, and workers become more connected to make our world smarter, safer, and more sustainable.

Overview of Honeywell's 2nd quarter 2021 earnings report
- Sales Growth and Margin Expansion in All Four Segments; Orders up Over 20%
- Reported Sales up 18%, Organic Sales up 15%
- Operating Margin up 450 Basis Points to 18.1%; Segment Margin up 190 Basis Points to 20.4%
- Earnings Per Share of $2.04, Adjusted Earnings Per Share of $2.02, up 60%
- Generated $1.3 Billion in Operating Cash Flow with Conversion of 89%, $1.5 Billion of Free Cash Flow with Adjusted Conversion of 103%
Honeywell's management commentary on their 2nd quarter 2021 earnings
CHARLOTTE, N.C., July 23, 2021 -- Honeywell (NASDAQ: HON) today announced outstanding results for the second quarter that were driven by sales and segment margin growth in all four businesses. The company also raised its full-year sales, segment margin, adjusted earnings per share, and cash flow guidance.
“Building on our first-quarter momentum, we executed extremely well in the second quarter. Our results were driven by top-line growth and margin expansion in all four segments. Organic sales grew 15%, led by doubledigit growth in Performance Materials and Technologies, Honeywell Building Technologies, and Safety and Productivity Solutions,” said Darius Adamczyk, chairman and chief executive officer of Honeywell. “Our increased volumes, streamlined cost base, and relentless focus on execution enabled us to expand segment margin by 190 basis points to 20.4%, exceeding the high end of our guidance by 10 basis points. As a result, we delivered adjusted earnings per share1 of $2.02, up 60% year over year and above the high end of our second-quarter guidance range. Our cash performance in the second quarter was strong, as we generated $1.5 billion of free cash flow with adjusted conversion2 of 103%, all while repurchasing $1.0 billion in Honeywell shares.”
“Building on our first-quarter momentum, we executed extremely well in the second quarter. Our results were driven by top-line growth and margin expansion in all four segments. Organic sales grew 15%, led by doubledigit growth in Performance Materials and Technologies, Honeywell Building Technologies, and Safety and Productivity Solutions,” said Darius Adamczyk, chairman and chief executive officer of Honeywell. “Our increased volumes, streamlined cost base, and relentless focus on execution enabled us to expand segment margin by 190 basis points to 20.4%, exceeding the high end of our guidance by 10 basis points. As a result, we delivered adjusted earnings per share1 of $2.02, up 60% year over year and above the high end of our second-quarter guidance range. Our cash performance in the second quarter was strong, as we generated $1.5 billion of free cash flow with adjusted conversion2 of 103%, all while repurchasing $1.0 billion in Honeywell shares.”
Adamczyk continued, “Our strong performance in the second quarter took place in a recovering but challenging global environment. We are especially pleased to see a turnaround in several of our key end markets that were hardest hit by the pandemic, with commercial aerospace aftermarket and the UOP business returning to growth in the quarter. We are well positioned to capitalize on improving conditions as they unfold around the world and to execute on near-term growth opportunities across our portfolio, including in the warehouse automation, productivity, building products, and advanced materials markets."
FULL-YEAR 2021 GUIDANCE Previous Guidance Current Guidance
FULL-YEAR 2021 GUIDANCE Previous Guidance Current Guidance
- Sales $34.0B - $34.8B $34.6B - $35.2B
- Organic Growth 3% - 5% 4% - 6%
- Segment Margin 20.7% - 21.1% 20.8% - 21.1%
- Expansion Up 30 - 70 bps Up 40 - 70 bps
- Adjusted Earnings Per Share $7.75 - $8.00 $7.95 - $8.10
- Adjusted Earnings Growth 9% - 13% 12% - 14%
- Operating Cash Flow $5.8B - $6.1B $5.9B - $6.2B
- Free Cash Flow $5.2B - $5.5B $5.3B - $5.6B
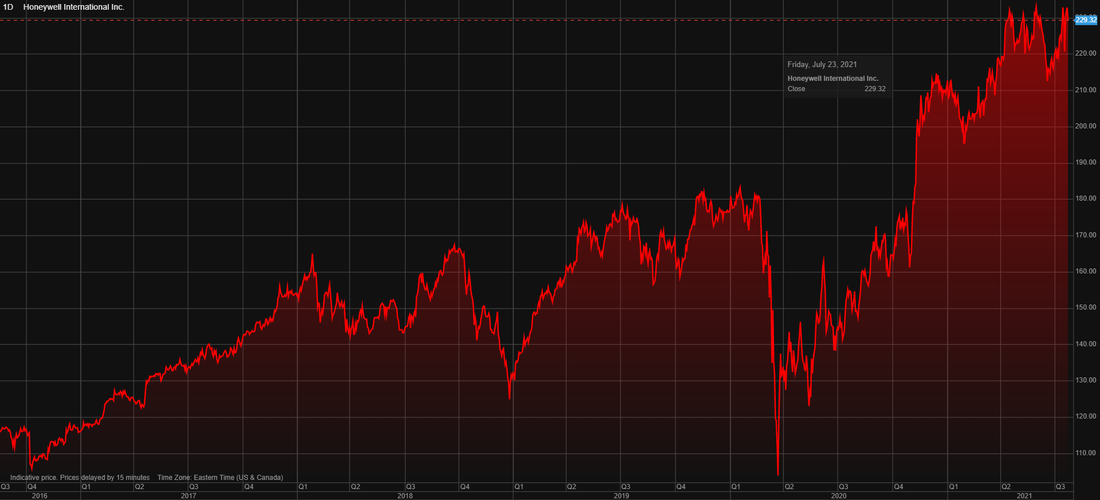
Honeywell (HON) stock price chart over the last 5 years
The image below shows the stock price history of Honeywell (NYSE:HON) over the last 5 years. And it's been decent time for Honeywell (NYSE:HON) over the last 5 years. The stock provided a 98% return to Honeywell stockholders over the last 5 years.
The stock of Honeywell is trading at a closer to its 52 week high than it is to its 52 week low which to us its an indication that the short sentiment and momentum of Honeywell is positive at this point in time.
The stock of Honeywell is trading at a closer to its 52 week high than it is to its 52 week low which to us its an indication that the short sentiment and momentum of Honeywell is positive at this point in time.
Honeywell (HON) stock price chart over the last 5 years
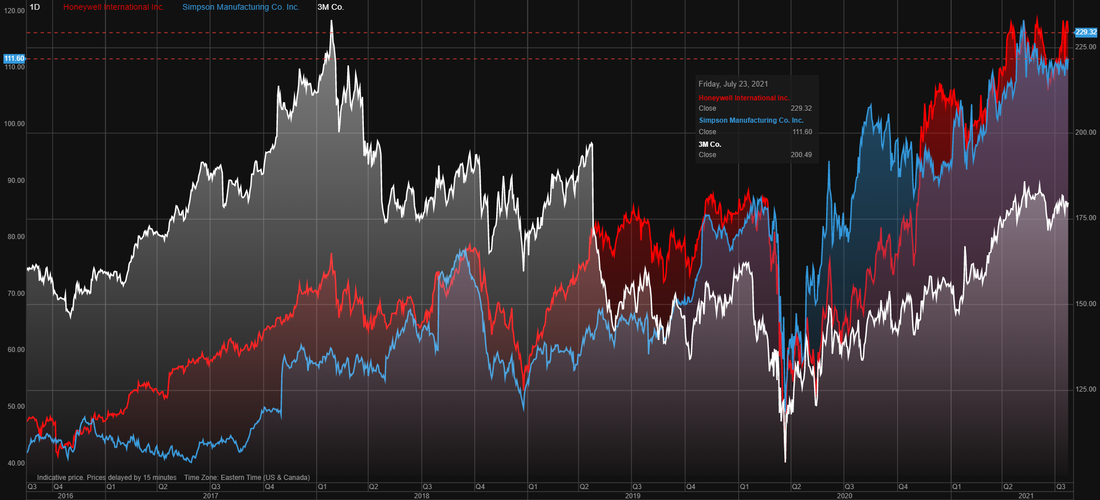
Honeywell (HON) vs 3M(MMM) vs Simpson Manufacturing (SSD) stock over the last 5 years
The image below shows the stock price performance of Honeywell (HON) vs 3M (MMM) vs Simpson Manufacturing (SSD) over the last 5 years. And while all three are active in the manufacturing space, their stock price performances are very different
So over the last 5 years Simpson has been by far the best performer and 3M the worst
- Simpson Manufacturing (SSD): 165.5%
- Honeywell (HON): 98%
- 3M (MMM): 11.9%
So over the last 5 years Simpson has been by far the best performer and 3M the worst
Honeywell (HON) vs 3M(MMM) vs Simpson Manufacturing (SSD) stock over the last 5 years
Honeywell (HON) latest stock valuation
So based on the 2nd quarter 2021 earnings report of Honeywell (HON) what do we value Honeywell (HON) stock at? Based on their 2nd quarter 2021 earnings report our valuation models provide a target price (full value price) for Honeywell stock at $149.10 a stock. We therefore believe the stock of Honeywell is overvalued.
We usually advise investors to look to enter a stock at least 10% below our target price (full value price) which in this case is $149.10So a good entry point into Honeywell would be around $134.20.00. We expect the stock price of Honeywell will pull back to levels closer to our target price (full value price) in coming weeks and months.
Since the stock of Honeywell is trading at well above our suggested entry point we rate the stock as a sell

Next earnings release of Honeywell
It is expected that Honeywell will release their 3rd quarter 2021 earnings report in late October 2021