|
Related Topics
|
|
Category: Stock Market and Interactive Brokers
Date: 23 January 2020 Stock Price: $49.19 We take a look at the 4th quarter earnings report of their 20219 fiscal year of Interactive Brokers. They and their affiliates provide securities, commodities and foreign exchange trade services in more than 125 markets in numerous countries and currencies.
|
|
About Interactive Brokers
Interactive Brokers Group affiliates provide automated trade execution and custody of securities, commodities and foreign exchange around the clock on over 125 markets in numerous countries and currencies, from a single IBKR Integrated Investment Account to customers worldwide. We service individual investors, hedge funds, proprietary trading groups, financial advisors and introducing brokers. Our four decades of focus on technology and automation has enabled us to equip our customers with a uniquely sophisticated platform to manage their investment portfolios at the lowest cost according to Barron's Best Online Brokers review, February 25, 2019. We strive to provide our customers with advantageous execution prices and trading, risk and portfolio management tools, research facilities and investment products, all at low or no cost, positioning them to achieve superior returns on investments.

Overview of Interactive Brokers' 4th quarter 2019 earnings report
Data below is reported for the latest quarter unless stated otherwise
- Revenue: $500 million (up from $492 million for the same quarter of the previous year)
- Revenue increased 1.62% over the last 12 months
- Non-interest expenses: $188 million (up from $183 million for the same quarter of the previous year)
- Non-interest expenses increased by 2.7% over the last 12 months
- Net earnings: $44 million (up from $43 million for the same quarter of the previous year)
- Diluted earnings per share: $0.57 (unchanged from $0.57 for the same quarter of the previous year)
- Diluted weighted-average shares outstanding: 77.357 million (up 2.04% from 75.810 million for the same quarter of the previous year)
- Cash and cash equivalents: $2.882 billion
- Cash and cash equivalents per share: $37.25
- Cash and cash equivalents makes up 75.8% of Interactive Brokers market capital
- Cash and cash equivalents makes up 4.02% of Interactive Brokers total assets
- Accounts receivable: $31.304 billion
- Accounts receivable makes up 43.7% of Interactive Brokers total assets
- Accounts receivable makes up 43.7% of Interactive Brokers total assets
- Stockholders equity of Interactive Brokers : $7.940 billion
- Stockholders equity per share: $102.64
- So Interactive Brokers is trading at 0.47 times its stockholders equity per share. This is well outside the expected range of between 2 and 4 most firms tend to trade at
Interactive Brokers management commentary on their 4th quarter earnings report
GREENWICH, CONN, April 16, 2019 — Interactive Brokers Group, Inc. (IEX: IBKR), an automated global electronic broker, reported diluted earnings per share on net income of $0.64 for the quarter ended March 31, 2019 compared to $0.63 for the same period in 2018, and diluted earnings per share on comprehensive income of $0.64 for the quarter, compared to $0.65 for the same period in 2018.
The Interactive Brokers Group, Inc. Board of Directors declared a quarterly cash dividend of $0.10 per share. This dividend is payable on March 13, 2020 to shareholders of record as of February 28, 2020.
Fourth Quarter 2019:
Full Year 2019:
Fourth Quarter 2019:
- 62% pretax profit margin for this quarter, down from 63% in the year-ago quarter.
- 65% Electronic Brokerage pretax profit margin for this quarter, up from 63% in the year-ago quarter.
- Customer equity grew 36% from the year-ago quarter to $174.1 billion and customer debits increased 15% to $31.0 billion.
- Customer accounts increased 15% from the year-ago quarter to 690 thousand.
- Total DARTs decreased 16% from the year-ago quarter to 797 thousand.
- Brokerage segment equity was $6.8 billion. Total equity was $7.9 billion.
Full Year 2019:
- 60% pretax profit margin for 2019, down from 63% in 2018.
- 62% Electronic Brokerage pretax profit margin for 2019, down from 64% in 2018.
- Total DARTs decreased 3% from 2018 to 833 thousand.
Interactive Brokers (NASDAQ: IBKR) stock price history
The image below, obtained from Google, shows the stock price history of Interactive Brokers (NASDAQ: IBKR) over the last 5 years. And it's been a pretty good time for Interactive Brokers stockholders. 5 years ago it was trading at around $30.50 and its currently trading at around $49.19 a stock. That's a strong return of 61.3% provided to Interactive Brokers stockholders over the last 5 years.
The stock of Interactive Brokers is trading at closer to its 52 week low of $44.50 than it is to its 52 week high high of $59.32 which to us is a clear indication that the short term sentiment and momentum of the stock of Interactive Brokers is negative.
The stock of Interactive Brokers is trading at closer to its 52 week low of $44.50 than it is to its 52 week high high of $59.32 which to us is a clear indication that the short term sentiment and momentum of the stock of Interactive Brokers is negative.
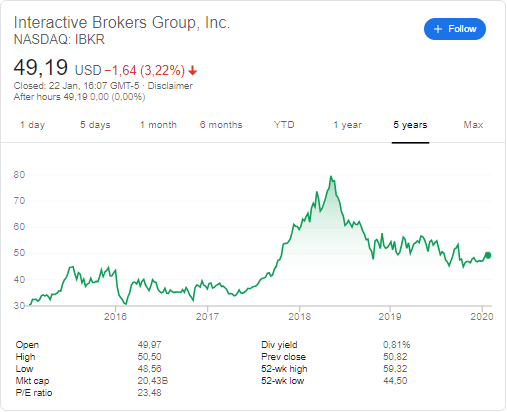
Interactive Brokers(NASDAQ: IBKR) stock price history over the last 5 years
Recent coverage of Interactive Brokers
The extract below discusses the latest results from United Airlines as obtained from Zacks,com
Interactive Brokers Group (IBKR - Free Report) recorded fourth-quarter 2019 adjusted earnings per share of 58 cents. The figure matched the prior-year quarter’s earnings. Results excluded certain non-recurring items. After considering these, net income came in at $294 million or 57 cents per share compared with $290 million or 57 cents per share in the prior-year quarter.
Results were impacted by escalating non-interest expenses and fall in daily average revenue trades (DARTs). Also, the company’s segmental net revenues failed to impress. However, rise in revenues acted as a tailwind. Interactive Brokers reported comprehensive income available to common shareholders of $51 million or 66 cents per share, up from $43 million or 56 cents per share in the prior-year quarter.
For 2019, earnings were $2.10 per share compared with the prior-year figure of $2.28. Net income decreased 3.2% to $1.1 billion.
Read the full article here

Charging Bull on Wall Street
Interactive Brokers (NASDAQ: IBKR) latest stock valuation
So what is Interactive Brokers stock worth based on the release of their latest earnings report and the fiscal guidance provided by Interactive Brokers? Based on their latest earnings results our valuation models provide a target (full value) price for Interactive Brokers at $37.80 an Interactive Brokers stock. We therefore believe that the stock is overvalued at its current price of $491.19
We usually suggest long term fundamental or value investors look to enter into a stock at least 10% below our target (full value) price which in this case is $37.80 Therefore we see a good entry point into Interactive Brokers stock at $34 or below.
We expect the stock of Interactive Brokers to pull back from current levels in coming weeks and months to levels closer to our target price (full value price).
Next earnings release of Interactive Brokers
It is expected that Interactive Brokers will release their 1st quarter 2020 earnings release in mid April 2020