|
Related Topics
|
|
Category: Stock Market and KB Home
Date: 12 January 2020 Stock Price: $35.86 We take a look at the 4th quarter earnings release of their 2019 fiscal year of home builder, KB Home, who delivered 3 929 homes during the 4th quarter of their 2019 fiscal year.
|
|
About KB Home
KB Home (NYSE: KBH) is one of the largest and most recognized homebuilders in the United States and has been building quality homes for over 60 years. Today, KB Home operates in 38 markets across eight states, serving a wide array of buyer groups. What sets us apart is giving our customers the ability to personalize their homes from homesites and floor plans to cabinets and countertops, at a price that fits their needs. And as the first builder ever to make every home we build ENERGY STAR® certified, KB Home is able to not only design thoughtful living spaces but ones that lower the cost of homeownership. We also work with our customers every step of the way, building strong personal relationships so they have a real partner in the homebuying process and the experience is as simple and easy as possible.

Overview of KB Home's 4th quarter 2020 earnings report
The numbers we are interested in (for the quarter):
Homes delivered for the 4th quarter of fiscal 2019:
- Total revenue: $1.558 billion (up from $1.348 billion from the same quarter of the previous year)
- Revenue increased by 15.6% over the last 12 months
- Cost and expenses: $1.390 billion (up from $1.222 billion for the same quarter of the previous year)
- Cost and expenses increased by 13.7% over the last 12 months
- Net income: $123.167 million (down from $96.836 million for the same quarter of the previous year)
- Diluted income per share: $1.31 (down from $0.96 for the same quarter of the previous year)
- Diluted weighted-average shares outstanding: 93.682 million (down from 100.809 million for the same quarter of the previous year)
- Cash and cash equivalents: $453.814 million
- Cash and cash equivalents per share: $4.84
- Cash and cash equivalents makes up 13.5% of KB Home's market capital
- Cash and cash equivalents makes up 9.05% of KB Home's total assets
- Accounts receivable: $249.055 million
- Accounts receivable makes up 4.9% of KB Home's total assets
- Inventories: $3.704 billion
- Inventories makes up 73.88% of KB Home's total assets
- Stockholders equity of KB Home: $2.383 billion
- Stockholders equity per share: $25.43
- KB Home is trading at 1.41 times its stockholders equity which is well outside the expected range of between 2 and 4 which most companies tend to trade at.
Homes delivered for the 4th quarter of fiscal 2019:
- West Coast: 1 199
- South Coast: 731
- Central: 1 302
- South East: 697
- Total: 3 929
KB Home's management commentary on the results and earnings guidance
LOS ANGELES--(BUSINESS WIRE)-- KB Home (NYSE: KBH) today reported results for its fourth quarter and year ended November 30, 2019.
“The fourth quarter marked an excellent finish to fiscal 2019, with particular strength in two key metrics – net order growth and housing gross profit margin,” said Jeffrey Mezger, Chairman, President and Chief Executive Officer. “Our net orders advanced 38% year over year, reflecting strong demand for our built-to-order product at affordable price points, together with limited inventory in our served markets. This substantial growth was driven by an increase in our community absorption pace to 3.7 net orders per month, our highest fourth quarter pace in many years, together with a 9% rise in our community count. Alongside our solid net orders was a robust gross margin, which expanded 120 basis points year over year, coming in just shy of 20%. This result was fueled, in part, by a continued reduction in our interest amortization – a significant achievement from executing on our Returns-Focused Growth Plan.”
“The fourth quarter marked an excellent finish to fiscal 2019, with particular strength in two key metrics – net order growth and housing gross profit margin,” said Jeffrey Mezger, Chairman, President and Chief Executive Officer. “Our net orders advanced 38% year over year, reflecting strong demand for our built-to-order product at affordable price points, together with limited inventory in our served markets. This substantial growth was driven by an increase in our community absorption pace to 3.7 net orders per month, our highest fourth quarter pace in many years, together with a 9% rise in our community count. Alongside our solid net orders was a robust gross margin, which expanded 120 basis points year over year, coming in just shy of 20%. This result was fueled, in part, by a continued reduction in our interest amortization – a significant achievement from executing on our Returns-Focused Growth Plan.”
“With the conclusion of the third year of this Plan, our 2019 results reflect incredibly strong progress relative to 2016 when we launched the Plan and set the stage for the new year. We have begun 2020 on sound footing, with a 26% year-over-year increase in our backlog value to $1.8 billion, and the composition of both our backlog and community portfolio reflecting higher margins. As such, we believe we are well positioned to further expand our profitability this year and meaningfully grow our return on equity.”
Backlog and Net Orders (comparisons on a year-over-year basis)
Balance Sheet as of November 30, 2019 (comparisons to November 30, 2018)
Backlog and Net Orders (comparisons on a year-over-year basis)
- Net orders for the quarter increased 38% to 2,777, with net order value up 43% to $1.06 billion.
- Company-wide, net orders per community averaged 3.7 per month, compared to 2.9 per month.
- The cancellation rate as a percentage of gross orders improved to 22% for the quarter from 28%.
- The Company’s ending backlog rose 24% to 5,078 homes. Ending backlog value grew to $1.81 billion, up 26% from $1.43 billion, with increases in all four regions.
- Average community count for the quarter increased 9% to 253. Ending community count grew 5% to 251.
Balance Sheet as of November 30, 2019 (comparisons to November 30, 2018)
- The Company had total liquidity of $1.23 billion, with $453.8 million of cash and cash equivalents and $781.1 million of available capacity under its unsecured revolving credit facility. There were no cash borrowings outstanding under the facility.
- On October 7, 2019, the Company completed an amendment to its unsecured revolving credit facility, increasing its borrowing capacity to $800.0 million from $500.0 million and extending its maturity by more than two years to October 2023.
- Net cash provided by operating activities in 2019 increased to $251.0 million. During the year, the Company used net cash of $330.4 million for financing activities, primarily to reduce debt, which contributed to a decrease of $120.5 million in the Company’s cash and cash equivalents.
- Inventories totaled $3.70 billion, up 3%.
- Investments in land acquisition and development totaled $1.62 billion in 2019.
- Lots owned or under contract increased to 64,910.
- This total includes 9,212 lots under contract with refundable deposits. Approximately 59% of the total lots were owned and 41% were under contract.
- The Company’s 38,039 owned lots represented an approximately 3.2 years’ supply based on homes delivered in 2019.
- Notes payable decreased by $311.5 million to $1.75 billion, primarily reflecting the repayment of convertible senior notes in the 2019 first quarter and financing transactions completed in the 2019 fourth quarter.
- On November 4, 2019, the Company completed the public offering of $300.0 million in aggregate principal amount of its 4.80% senior notes due 2029. On November 22, 2019, the Company used the proceeds from this offering, together with cash on hand, to redeem all $350.0 million in aggregate principal amount of its 8.00% senior notes due March 15, 2020.
- The Company’s debt to capital ratio of 42.3% improved 740 basis points. The Company’s net debt to capital ratio was 35.2%.
- Stockholders’ equity increased to $2.38 billion from $2.09 billion.
- Book value per share grew by $2.59 to $26.60.
KB Home (NYSE: KBH) stock price history
The image below shows the stock price history of KB Home (NYSE: KBH) over the last 5 years. And it's been a good time for KB Home stockholders. 5 years ago KB Home was trading around $15 a stock, and its currently it's trading at $32.38 Thats a decent return of 115.8% provided over the last 5 years. The stock is also trading at a lot closer to its 52 week high of $32.48 than it is to its 52 week low of $16.82 which to us is a clear indication that the short term sentiment and momentum of KB Home's stock is very positive.
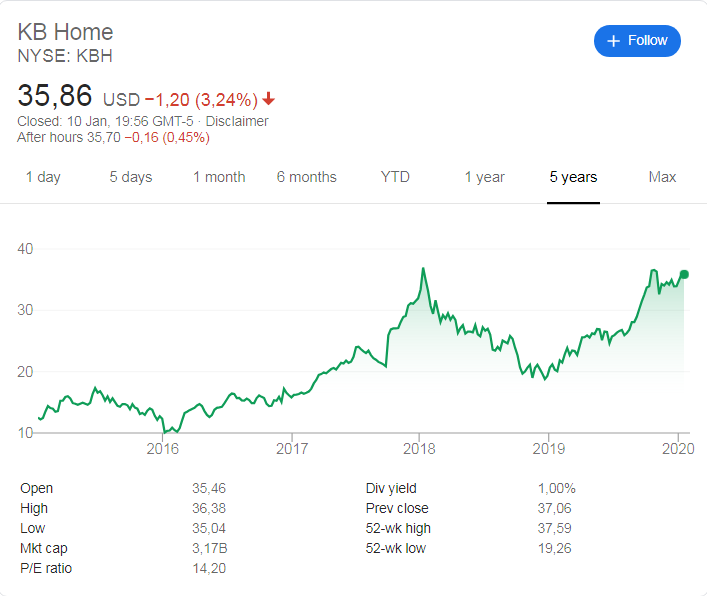
KB Home (NYSE: KBH) stock price history over the last 5 years.
Recent coverage of KB Home
The extract below shows recent coverage of KB Homes as obtained from TheStreet.com
KB Home (KBH) - Get Report posted better-than-expected earnings, but lower-than-expected revenue for its fiscal fourth quarter Thursday. The home-building company reported net income of $123.2 million, or $1.31 per diluted share, on revenue of $1.56 billion. Analysts surveyed by FactSet had projected adjusted net income of $120.3 million, or $1.28 a share, on sales of $1.6 billion.
In the same period a year ago, the company posted earnings of 96 cents a share on sales of $1.3 billion. It reported net income of $97 million. Shares fell 95 cents, or 2.6%, to $36.11 in after-hours trading. Quarterly estimates had fallen 3.6 cents a share in the past month. In the upcoming quarter analysts are forecasting adjusted net income of $39.9 million, or 42 cents a share, on sales of $966.5 million. KB Home is currently trading at a price-to-forward-earnings ratio of 11.9 based on the 12-month estimates of 17 analysts surveyed by FactSet.
Read the original article here
KB Home's (NYSE: KBH) latest stock valuation
So based on the 4th quarter 2019 earnings report of KB Home (NYSE:KBH) what do we value KB Homes (KBH) stock at? Based on their latest earnings report our valuation model provides a target price (full value price) for KB Homes at $41.70 a stock. We therefore believe the stock of KB Home is undervalued
We usually suggest long term fundamental and value investors look to enter the stock at least 10% below our target price, which in this case is $41.70 Therefore we believe the a good entry point into the stock is below $37.50. We expect the stock of KB Homes to edge higher in coming weeks and months to levels closer to our target price (full value price).
We usually suggest long term fundamental and value investors look to enter the stock at least 10% below our target price, which in this case is $41.70 Therefore we believe the a good entry point into the stock is below $37.50. We expect the stock of KB Homes to edge higher in coming weeks and months to levels closer to our target price (full value price).
Next earnings release of KB Home
It is expected that KB Home will release their 1st quarter 2020 earnings report in early April 2020