
|
Related Topics
|
|
Category: Lululemon and Stock Market
Last updated: 8 June 2020 Stock price: $319.78 On this page we will look to provide more details, often not covered by mainstream financial websites about Lululemon, a designer, distributor and retailer of healthy lifestyle inspired apparel and accessories with revenues in 2019 coming in at just below $4 billion
|

|
About Lululemon
lululemon athletica inc. is principally a designer, distributor, and retailer of healthy lifestyle inspired athletic apparel and accessories. We have a vision to be the experiential brand that ignites a community of people through sweat, grow, and connect, which we call "living the sweatlife." Since our inception, we have fostered a distinctive corporate culture; we promote a set of core values in our business which include taking personal responsibility, nurturing entrepreneurial spirit, acting with honesty and courage, valuing connection, and choosing to have fun. These core values attract passionate and motivated employees who are driven to achieve personal and professional goals, and share our purpose "to elevate the world by unleashing the full potential within every one of us."
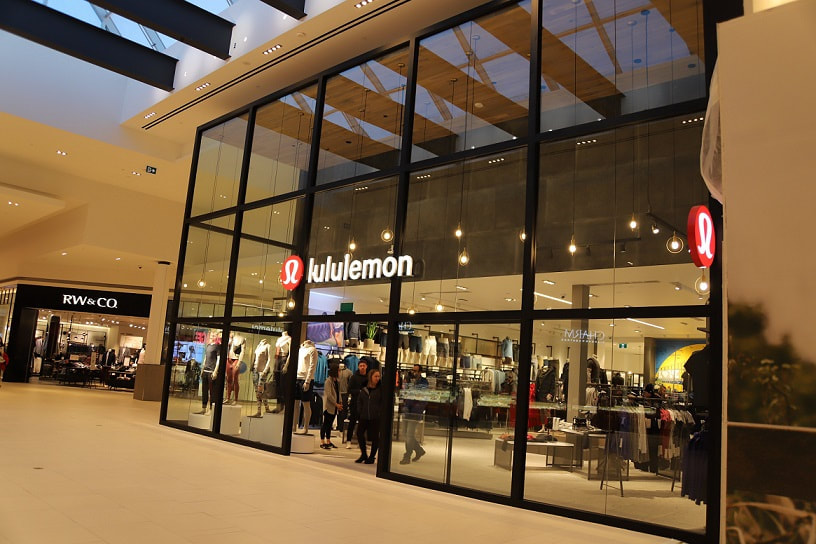
Lululemon store front in a shopping mall
Quick facts about Lululemon
- Lululemon is listed on the Nasdaq under share code ticker: LULU
- Lululemon has 491 company operated retail outlets
- Lululemon employs roughly 19 000 people
- Revenues in 2019: $3.979 billion
- Earnings per share in 2019: $4.93
- Shares in issue: 130.935 million
- Cash and equivalents as at end of 2019: $1.093 billion
- Stockholders equity in Lululemon: $1.952 billion
- Stockholders equity per Lululemon share: $14.91
Products of Lululemon
Our healthy lifestyle inspired athletic apparel and accessories are marketed under the lululemon brand. We offer a comprehensive line of apparel and accessories for women and men. Our apparel assortment includes items such as pants, shorts, tops, and jackets designed for a healthy lifestyle including athletic activities such as yoga, running, training, and most other sweaty pursuits. We also offer fitness-related accessories. Our design and development team continues to source technically advanced fabrics, with new feel and fit, and craft innovative functional features for our products. Through our vertical retail strategy and direct connection with our guests, we are able to collect feedback and incorporate unique performance and fashion needs into our design process. In this way, we believe we solve problems for our guests, helping us advance our product lines and differentiate us from the competition. Although we benefit from the growing number of people that participate in yoga, we believe the percentage of our products sold for other activities will continue to increase as we broaden our product range.
Royal Caribbean Cruises ship
Lululemon market
Our guests seek a combination of performance, style, and sensation in their athletic apparel, choosing products that allow them to feel great however they exercise. Since consumer purchase decisions are driven by both an actual need for functional products and a desire to live a particular lifestyle, we believe the credibility of our brand and the authentic community experiences we offer expand our potential market beyond just athletes to those who pursue an active, mindful, and balanced life. 2 Although our primary and largest customer group is made up of women, we also design a comprehensive men's line and have a targeted strategy in place to serve our male guests. Our business is growing as more men discover the technical rigor and premium quality of our products, and are attracted by our distinctive brand. North America is our largest market by geographical split, offering a mature health and wellness industry and sophisticated consumer. Additionally, we are expanding internationally across Europe, the People's Republic of China ("PRC"), and the rest of Asia Pacific. We are expanding in these regions via a decentralized model, allowing for local community insight and consumer preference to inform our strategic expansion.
Business strategy of Lululemon
The Power of Three
We believe the first year of our Power of Three growth plan proved to be particularly successful. The strategic pillars of this plan are product innovation, omni-guest experience, and market expansion.
Product Innovation
Throughout fiscal 2019, response to our product offerings was strong as we continued to grow our core product categories, expand our merchandise range, and deliver new innovation through our Science of Feel development platform. Momentum continued in both our men's and women's pant category, and we continued to expand the important categories of bras and outerwear. In men's, one of our key growth areas, revenue increased 34% in 2019. We also moved beyond test phase with our new assortment of selfcare personal-care products. We rolled out our initial assortment to 50 stores and online.
Omni-Guest Experience
Performance was strong across both our company-operated store and direct to consumer channels in fiscal 2019, with comparable store sales increasing 9% and direct to consumer net revenue growing 35%, each based on a shifted calendar. In fiscal 2019 we began to engage with our guests in new ways. We began testing a new membership program, with four markets tested in fiscal 2019. We also opened and began testing our first two fully experiential stores in 2019, one in the Lincoln Park neighborhood of Chicago and the second at the Mall of America near Minneapolis. These stores were designed to offer dedicated studio space for sweat classes and meditation, locker rooms, healthy foods, and an elevated shopping experience. In fiscal 2019 we continued to host unique events in North America and in our international markets. In addition to our SeaWheeze half marathon and festival in Vancouver, we hosted 10K races in Toronto, Edmonton, and San Diego, our first in the United States. In Europe, we held Sweatlife festivals in London, Paris, and Berlin, and in Mainland China, we hosted our 4th annual Unroll China event. These festivals and events brought together guests, educators, ambassadors, and other members of the local community to engage in sweat classes, yoga, personal development, and meditation.
Market Expansion
In fiscal 2019, we continued to expand our presence both in North America and in our international markets. During the year, we opened 51 net new company-operated stores, including 19 in North America, 24 in Asia Pacific, and eight in Europe. We expanded into two new markets in Europe during the year, the Netherlands and Norway. We also launched local market ecommerce sites in Germany and France. In Asia, we opened our first stores in Malaysia and launched a local e-commerce site in Japan. We also expanded our seasonal store strategy in fiscal 2019 with approximately 80 seasonal stores in operation for some period of time during the year. These stores allowed us to better cater to our guests in select markets, particularly during the holidays, while also helping introduce new guests to our brand. For fiscal 2019, our business in North America grew 20%, while total growth in our international markets was 32%
Competion of Lululemon
Competition in the athletic apparel industry is based principally on brand image and recognition as well as product quality, innovation, style, distribution, and price. We believe that we successfully compete on the basis of our premium brand image and our technical product innovation. We also believe our ability to introduce new product innovations, combine function and fashion, and connect through in-store and community experiences sets us apart from our competition. In addition, we believe our vertical retail distribution strategy and community-based marketing differentiates us further, allowing us to more effectively control our brand image and connect with our guest. The market for athletic apparel is highly competitive. It includes increasing competition from established companies that are expanding their production and marketing of performance products, as well as from frequent new entrants to the market. We are in direct competition with wholesalers and direct sellers of athletic apparel, such as Nike, Inc., adidas AG, and Under Armour, Inc. We also compete with retailers who have expanded to include women's athletic apparel including The Gap, Inc. (including the Athleta brand) and Victoria's Secret with its Sport collection.
Intellectual Property of Lululemon
We own a number of registered trademarks related to the Royal Caribbean International, Celebrity Cruises, Azamara and Silversea Cruises cruise brands. The registered trademarks include the name “Royal Caribbean International” and its crown and anchor logo, the name “Celebrity Cruises” and its “X” logo, the name “Azamara” and its "open world" and "star logo", the name “Silversea Cruises” and its logo, and the names of various cruise ships, ship venues and other marketing programs. We believe our largest brands' trademarks are widely recognized throughout the world and have considerable value. The duration of trademark registrations varies from country to country. However, trademarks are generally valid and may be renewed indefinitely as long as they are in use and/or their registrations are properly maintained
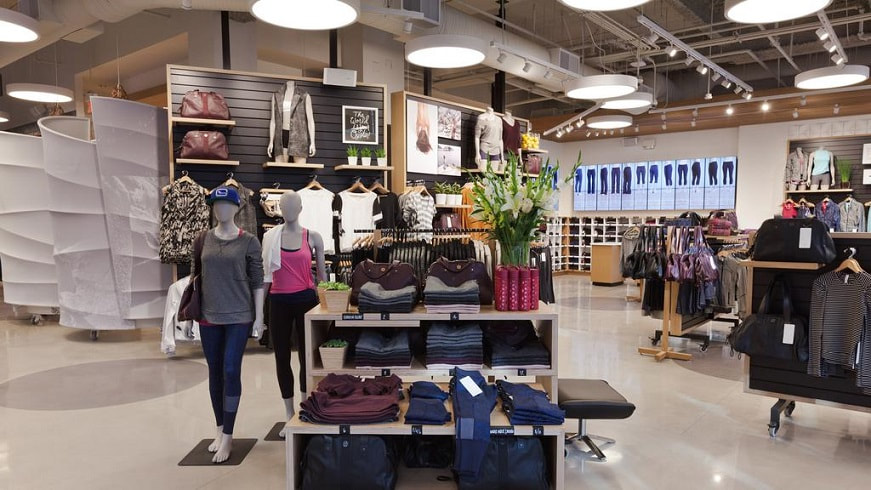
Inside a Lululemon store
Segments of Lululemon
We primarily conduct our business through two channels: company-operated stores and direct to consumer. We also generate net revenue from outlets, sales from temporary locations, sales to wholesale accounts, through license and supply arrangements, and warehouse sales. The net revenue we generate from these sources is combined in our other segment. We operate in both the physical and digital space to better cater to the shopping desires of our guest. At the end of fiscal 2019, we had 491 stores in 17 countries across the globe. In addition to being a venue to sell product, our stores give us a direct connection to our guest, which we view as a valuable tool in helping us build our brand and product line.
Our direct to consumer segment includes the net revenue which we generate from our e-commerce website www.lululemon.com, other country and region specific websites, and mobile apps, including mobile apps on in-store devices that allow demand to be fulfilled via our distribution centers or other retail locations.
Company-Operated Stores
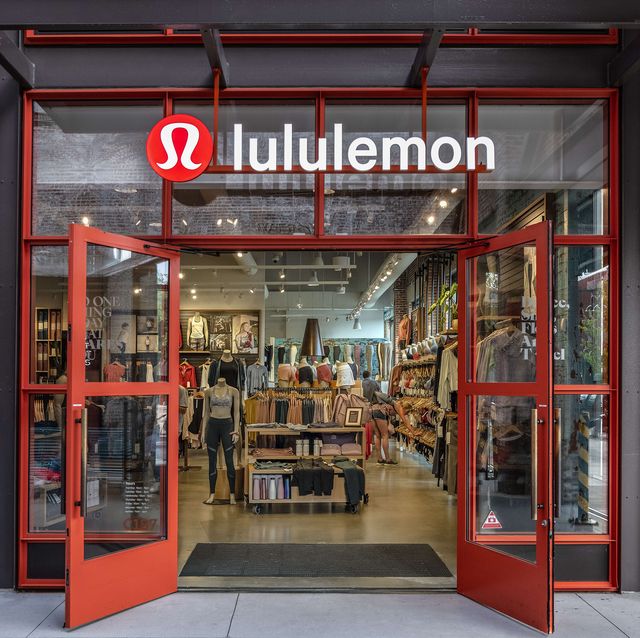
As of February 2, 2020, our retail footprint included 491 company-operated stores. While most of our company-operated stores are branded lululemon, five of our company-operated stores are branded ivivva and specialize in athletic wear for female youth. Our retail stores are located primarily on street locations, in lifestyle centers, and in malls.
The summary below shows the number of Lululemon stores per country
We opened 51 net new company-operated stores in fiscal 2019, including 32 net new stores outside of North America. We perform ongoing evaluations of our portfolio of company-operated store locations. During fiscal 2019, we closed four of our lululemon branded company-operated stores and two of our ivivva branded company-operated stores. As we continue our evaluations we may, in future periods, close or relocate additional company-operated stores. In fiscal 2020, our new store growth will come primarily from company-operated store openings in Asia and in the United States. Our real estate strategy over the next several years will not only consist of opening new company-operated stores, but also in overall square footage growth through store expansions and relocations. We believe that our innovative retail concept and guest experience contribute to the success of our stores. We use sales per square foot to assess the performance of our company-operated stores relative to their square footage. We believe that sales per square foot is useful in evaluating the performance of our company-operated stores. During fiscal 2019, our sales per square foot was $1,657. Sales per square foot is calculated using total net revenue from company-operated stores that opened, or opened in their significantly expanded space, prior to the current fiscal year. The total net revenue of these stores for the fiscal year is divided by the total square footage of these stores at the end of the year. The fiscal 2019 sales per square foot metric is based on an average square footage of 3,127 per store as of February 2, 2020. In fiscal years with 53 weeks, the 53rd week of net revenue is excluded from the calculation of sales per square foot. The square footage of our company-operated stores includes all retail related space, storage areas, and administrative space used by the store employees. It excludes any space used for non-retail related activities. The sales per square foot metric we report may not be equivalent to similarly titled metrics reported by other companies.
Direct to Consumer
Direct to consumer is a substantial part of our business, representing 28.6% of our net revenue in fiscal 2019. We believe that e-commerce is convenient for our core customer and enhances the image of our brand. Our direct to consumer channel 4 makes our product accessible to more markets than our company-operated store channel alone. We believe this channel is effective in building brand awareness, especially in new markets. We continue to evolve and integrate our digital and physical channels in order to enrich our interactions with our guests, and to provide an enhanced omni-channel experience. Other Channels Other net revenue accounted for 8.6% of total net revenue in fiscal 2019, compared to 9.2% in fiscal 2018, and 8.9% of total net revenue in fiscal 2017. Other net revenue includes sales made through the following channels:
We have entered into license and supply arrangements with partners in the Middle East and Mexico which grant them the right to operate lululemon branded retail locations in the United Arab Emirates, Kuwait, Qatar, Oman, Bahrain, and Mexico. We retain the rights to sell lululemon products through our e-commerce websites in these countries. Under these arrangements we supply the partners with lululemon products, training and other support. The initial term of the agreement for the Middle East expired in January 2020 and we currently intend to stay in the market. The initial term of the agreement for Mexico expires in November 2026. As of February 2, 2020, there were four licensed retail locations in Mexico, three in the United Arab Emirates, and one in Qatar, which are not included in the above company-operated stores table.
Our direct to consumer segment includes the net revenue which we generate from our e-commerce website www.lululemon.com, other country and region specific websites, and mobile apps, including mobile apps on in-store devices that allow demand to be fulfilled via our distribution centers or other retail locations.
Company-Operated Stores
As of February 2, 2020, our retail footprint included 491 company-operated stores. While most of our company-operated stores are branded lululemon, five of our company-operated stores are branded ivivva and specialize in athletic wear for female youth. Our retail stores are located primarily on street locations, in lifestyle centers, and in malls.
The summary below shows the number of Lululemon stores per country
- United States. . . . . . . . . . . . . . . . . . . . . . . . . . . . . . . . . . . . . . . . . . . . . . . . . . . . . . . . . . . . . . . . . 305
- Canada. . . . . . . . . . . . . . . . . . . . . . . . . . . . . . . . . . . . . . . . . . . . . . . . . . . . . . . . . . . . . . . . . . . . . . 63
- People's Republic of China. . . . . . . . . . . . . . . . . . . . . . . . . . . . . . . . . . . . . . . . . . . . . . . . . . . . 38
- Australia . . . . . . . . . . . . . . . . . . . . . . . . . . . . . . . . . . . . . . . . . . . . . . . . . . . . . . . . . . . . . . . . . . . . 31
- United Kingdom . . . . . . . . . . . . . . . . . . . . . . . . . . . . . . . . . . . . . . . . . . . . . . . . . . . . . . . . . . . . . . 14
- Japan . . . . . . . . . . . . . . . . . . . . . . . . . . . . . . . . . . . . . . . . . . . . . . . . . . . . . . . . . . . . . . . . . . . . . . . 7
- New Zealand . . . . . . . . . . . . . . . . . . . . . . . . . . . . . . . . . . . . . . . . . . . . . . . . . . . . . . . . . . . . . . . . . 7
- Germany . . . . . . . . . . . . . . . . . . . . . . . . . . . . . . . . . . . . . . . . . . . . . . . . . . . . . . . . . . . . . . . . . . . . 6
- South Korea. . . . . . . . . . . . . . . . . . . . . . . . . . . . . . . . . . . . . . . . . . . . . . . . . . . . . . . . . . . . . . . . . . 5
- Singapore . . . . . . . . . . . . . . . . . . . . . . . . . . . . . . . . . . . . . . . . . . . . . . . . . . . . . . . . . . . . . . . . . . . 4
- France . . . . . . . . . . . . . . . . . . . . . . . . . . . . . . . . . . . . . . . . . . . . . . . . . . . . . . . . . . . . . . . . . . . . . . 3
- Malaysia . . . . . . . . . . . . . . . . . . . . . . . . . . . . . . . . . . . . . . . . . . . . . . . . . . . . . . . . . . . . . . . . . . . . 2
- Sweden . . . . . . . . . . . . . . . . . . . . . . . . . . . . . . . . . . . . . . . . . . . . . . . . . . . . . . . . . . . . . . . . . . . . . 2
- Ireland . . . . . . . . . . . . . . . . . . . . . . . . . . . . . . . . . . . . . . . . . . . . . . . . . . . . . . . . . . . . . . . . . . . . . . 1
- Netherlands . . . . . . . . . . . . . . . . . . . . . . . . . . . . . . . . . . . . . . . . . . . . . . . . . . . . . . . . . . . . . . . . . . 1
- Norway . . . . . . . . . . . . . . . . . . . . . . . . . . . . . . . . . . . . . . . . . . . . . . . . . . . . . . . . . . . . . . . . . . . . . 1
- Switzerland . . . . . . . . . . . . . . . . . . . . . . . . . . . . . . . . . . . . . . . . . . . . . . . . . . . . . . . . . . . . . . . . . . 1
- Total company-operated stores . . . . . . . . . . . . . . . . . . . . . . . . . . . . . . . . . . . . . . . . . . . . . . . . . . . 491
We opened 51 net new company-operated stores in fiscal 2019, including 32 net new stores outside of North America. We perform ongoing evaluations of our portfolio of company-operated store locations. During fiscal 2019, we closed four of our lululemon branded company-operated stores and two of our ivivva branded company-operated stores. As we continue our evaluations we may, in future periods, close or relocate additional company-operated stores. In fiscal 2020, our new store growth will come primarily from company-operated store openings in Asia and in the United States. Our real estate strategy over the next several years will not only consist of opening new company-operated stores, but also in overall square footage growth through store expansions and relocations. We believe that our innovative retail concept and guest experience contribute to the success of our stores. We use sales per square foot to assess the performance of our company-operated stores relative to their square footage. We believe that sales per square foot is useful in evaluating the performance of our company-operated stores. During fiscal 2019, our sales per square foot was $1,657. Sales per square foot is calculated using total net revenue from company-operated stores that opened, or opened in their significantly expanded space, prior to the current fiscal year. The total net revenue of these stores for the fiscal year is divided by the total square footage of these stores at the end of the year. The fiscal 2019 sales per square foot metric is based on an average square footage of 3,127 per store as of February 2, 2020. In fiscal years with 53 weeks, the 53rd week of net revenue is excluded from the calculation of sales per square foot. The square footage of our company-operated stores includes all retail related space, storage areas, and administrative space used by the store employees. It excludes any space used for non-retail related activities. The sales per square foot metric we report may not be equivalent to similarly titled metrics reported by other companies.
Direct to Consumer
Direct to consumer is a substantial part of our business, representing 28.6% of our net revenue in fiscal 2019. We believe that e-commerce is convenient for our core customer and enhances the image of our brand. Our direct to consumer channel 4 makes our product accessible to more markets than our company-operated store channel alone. We believe this channel is effective in building brand awareness, especially in new markets. We continue to evolve and integrate our digital and physical channels in order to enrich our interactions with our guests, and to provide an enhanced omni-channel experience. Other Channels Other net revenue accounted for 8.6% of total net revenue in fiscal 2019, compared to 9.2% in fiscal 2018, and 8.9% of total net revenue in fiscal 2017. Other net revenue includes sales made through the following channels:
- Outlets and warehouse sales - We utilize outlets as well as physical warehouse sales, which are held from time to time, to sell slow moving inventory and inventory from prior seasons to retail customers at discounted prices.
- Temporary locations - Our temporary locations, including seasonal stores, are typically opened for a short period of time in markets in which we may not already have a presence.
- Wholesale - Our wholesale accounts include premium yoga studios, health clubs, and fitness centers. We believe these premium wholesale locations offer an alternative distribution channel that is convenient for our core consumer and enhances the image of our brand. We do not intend wholesale to be a significant contributor to overall sales. Instead, we use the channel to build brand awareness, including outside of North America.
- License and supply arrangements - We enter into license and supply arrangements from time to time when we believe that it will be to our advantage to partner with companies and individuals with significant experience and proven success in certain target markets.
We have entered into license and supply arrangements with partners in the Middle East and Mexico which grant them the right to operate lululemon branded retail locations in the United Arab Emirates, Kuwait, Qatar, Oman, Bahrain, and Mexico. We retain the rights to sell lululemon products through our e-commerce websites in these countries. Under these arrangements we supply the partners with lululemon products, training and other support. The initial term of the agreement for the Middle East expired in January 2020 and we currently intend to stay in the market. The initial term of the agreement for Mexico expires in November 2026. As of February 2, 2020, there were four licensed retail locations in Mexico, three in the United Arab Emirates, and one in Qatar, which are not included in the above company-operated stores table.
Employees of Lululemon
We believe that our people are key to the success of our business, and we strive to foster a distinctive corporate culture rooted in our core business values which attract passionate and motivated employees who are driven to achieve personal and professional goals. As of February 2, 2020, we had approximately 19,000 employees, of which approximately 11,000 were employed in the United States, approximately 5,200 were employed in Canada, and approximately 2,800 were employed outside of North America. None of our employees are currently covered by a collective bargaining agreement. We have had no labor-related work stoppages by our employees and we believe our relations with our employees are excellent.
Seasonality of Lululemons earnings
Our business is affected by the general seasonal trends common to the retail apparel industry. Our annual net revenue is weighted more heavily toward our fourth fiscal quarter, reflecting our historical strength in sales during the holiday season, while our operating expenses are more equally distributed throughout the year. As a result, a substantial portion of our operating profits are generated in the fourth quarter of our fiscal year. For example, we generated approximately 47% of our full year operating profit during each of the fourth quarters of fiscal 2019 and fiscal 2018.
Marketing of Lululemon
We utilize a community-based approach to build brand awareness and customer loyalty. We pursue a multi-faceted strategy which leverages our local teams and ambassadors, digital marketing and social media, in-store community boards, and a variety of grassroots initiatives. We also plan to continue to explore how we can complement and amplify our communitybased initiatives with global brand-building activity.
Lululemon (NASDAQ: LULU) stock performance
The graph set forth below compares the cumulative total stockholder return on our common stock between February 1, 2015 (the date of our fiscal year end five years ago) and February 2, 2020, with the cumulative total return of (i) the S&P 500 Index and (ii) S&P 500 Apparel, Accessories & Luxury Goods Index, over the same period. This graph assumes the investment of $100 on February 1, 2015 at the closing sale price our common stock, the S&P 500 Index and the S&P Apparel, Accessories & Luxury Goods Index and assumes the reinvestment of dividends, if any.
The comparisons shown in the graph below are based on historical data. We caution that the stock price performance showing in the graph below is not necessarily indicative of, nor is it intended to forecast, the potential future performance of our common stock. Information used in the graph was obtained from Bloomberg, a source believed to be reliable, but we are not responsible for any errors or omissions in such information.
The comparisons shown in the graph below are based on historical data. We caution that the stock price performance showing in the graph below is not necessarily indicative of, nor is it intended to forecast, the potential future performance of our common stock. Information used in the graph was obtained from Bloomberg, a source believed to be reliable, but we are not responsible for any errors or omissions in such information.
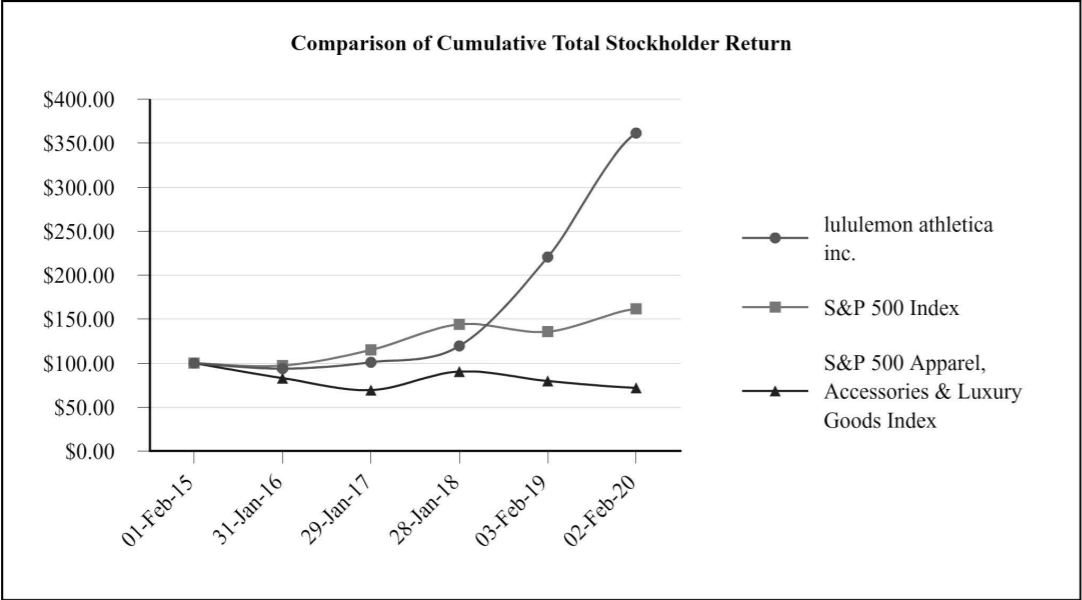
Lululemon stock vs S&P 500 vs S&P 500 apparel, accessories & luxury goods index
Over the 5 year period Lululemon provided an average annual return of 29.3% while the S&P 500 returned 10.1% per annum. The stock of Lululemon has slightly outperformed the S&P 500 over the last 5 years. Over the 5 year period the stock of Lululemon increased 2.9 times that of the S&P 500
Our latest Lululemon stock valuation (28 March 2020)
Based on Lululemon's 4th quarter 2019 earnings report from Lululemon what do we value their stock at? Based on Lululemon's earnings reported and their full fiscal 2019 earnings our valuation model provides a target price (full value) price of $151.90 a Lululemon stock (up slightly from our 3rd quarter 2019 earnings report valuation of Lululemon).
We therefore believe that the stock of Lululemon is overvalued. We usually recommend that long term fundamental and value investors look to enter a stock at least 10% below our target price which in this case is $151.90. A good entry point into Lululemon would therefore be at $136.70 or below. Since the stock of Lululemon is trading at well above our target price we rate the stock of Lululemon as avoid.
We expect it to pull back strongly from current levels to levels closer to our target price in coming weeks and months.