|
Related Topics
|
|
Category: Starbucks Corporation and Stock Market
Last updated: 26 May 2020 Stock price: $77.62 On this page we will look to provide more details about Starbucks Corporation one of the world's best known coffee brands, focusing on information that might not always be published or used in mainstream media.
|
|
About Starbucks Corporation
Starbucks is the premier roaster, marketer and retailer of specialty coffee in the world, operating in 81 markets. Formed in 1985, Starbucks Corporation’s common stock trades on the NASDAQ Global Select Market (“NASDAQ”) under the symbol “SBUX.” We purchase and roast high-quality coffees that we sell, along with handcrafted coffee, tea and other beverages and a variety of high-quality food items through company-operated stores. We also sell a variety of coffee and tea products and license our trademarks through other channels such as licensed stores, as well as grocery and foodservice through our Global Coffee Alliance with Nestlé S. A. ("Nestlé"). In addition to our flagship Starbucks Coffee brand, we sell goods and services under the following brands: Teavana, Seattle’s Best Coffee, Evolution Fresh, Ethos, Starbucks Reserve and Princi.
Quick facts about Starbucks (NASDAQ: SBUX)
- Starbucks is listed on the Nasdaq exchange under stock code ticker: SBUX
- Total revenues for 2019 fiscal year : $26.508 billion
- Company operated stores: 15 834
- Licensed stores: 15 422
- Beverage sales makes up 74% of Starbucks revenues
More details about Starbucks
Starbucks has three reporting segments. They are:
1) Americas, which is inclusive of the U.S., Canada, and Latin America;
2) International, which is inclusive of China, Japan, Asia Pacific, Europe, Middle East, and Africa; and
3) Channel Development. Non-reportable operating segments such as Evolution Fresh and unallocated corporate expenses are reported within Corporate and Other.
Revenues from our reportable operating segments as a percentage of total net revenues for fiscal 2019 were as follows:
Our Americas and International segments include both company-operated and licensed stores. Our Americas segment is our most mature business and has achieved significant scale. Certain markets within our International operations are either in various stages of development or undergoing transformations of their business models. Therefore, they may require a more extensive support organization, relative to their current levels of revenue and operating income, than our Americas operations.
Our Channel Development segment includes roasted whole bean and ground coffees, Seattle's Best Coffee®, Starbucks- and Teavana-branded single-serve products, a variety of ready-to-drink beverages, such as Frappuccino®, Starbucks Doubleshot®, Starbucks Refreshers® beverages and TeavanaTM/MC iced tea, and other branded products sold worldwide outside of our company-operated and licensed stores.
Historically our consumer packaged goods ("CPG") have been sold directly to grocery, warehouse club and specialty retail stores and through institutional foodservice companies. With the establishment of the Global Coffee Alliance with Nestlé, a large portion of our Channel Development business transitioned to a licensed model in the fourth quarter of fiscal 2018. Our collaborative relationships with PepsiCo, Inc., Anheuser-Busch InBev, Tingyi Holding Corp., Arla Foods and others for our global ready-to-drink beverage businesses in this segment are excluded from the Global Coffee Alliance
1) Americas, which is inclusive of the U.S., Canada, and Latin America;
2) International, which is inclusive of China, Japan, Asia Pacific, Europe, Middle East, and Africa; and
3) Channel Development. Non-reportable operating segments such as Evolution Fresh and unallocated corporate expenses are reported within Corporate and Other.
Revenues from our reportable operating segments as a percentage of total net revenues for fiscal 2019 were as follows:
- Americas (69%)
- International (23%)
- Channel Development (8%)
Our Americas and International segments include both company-operated and licensed stores. Our Americas segment is our most mature business and has achieved significant scale. Certain markets within our International operations are either in various stages of development or undergoing transformations of their business models. Therefore, they may require a more extensive support organization, relative to their current levels of revenue and operating income, than our Americas operations.
Our Channel Development segment includes roasted whole bean and ground coffees, Seattle's Best Coffee®, Starbucks- and Teavana-branded single-serve products, a variety of ready-to-drink beverages, such as Frappuccino®, Starbucks Doubleshot®, Starbucks Refreshers® beverages and TeavanaTM/MC iced tea, and other branded products sold worldwide outside of our company-operated and licensed stores.
Historically our consumer packaged goods ("CPG") have been sold directly to grocery, warehouse club and specialty retail stores and through institutional foodservice companies. With the establishment of the Global Coffee Alliance with Nestlé, a large portion of our Channel Development business transitioned to a licensed model in the fourth quarter of fiscal 2018. Our collaborative relationships with PepsiCo, Inc., Anheuser-Busch InBev, Tingyi Holding Corp., Arla Foods and others for our global ready-to-drink beverage businesses in this segment are excluded from the Global Coffee Alliance
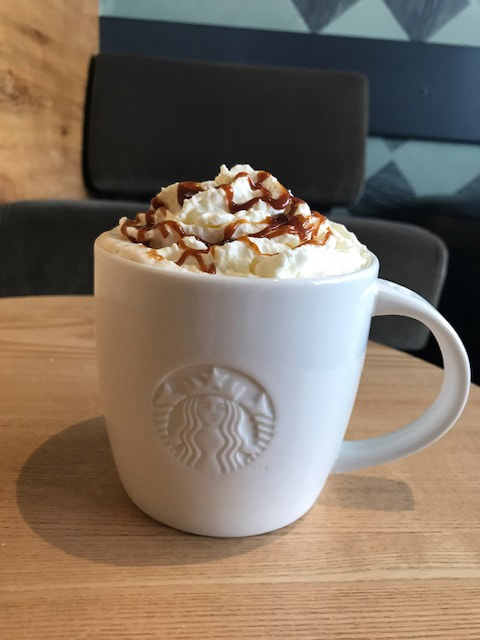
Starbucks Cappuccino with cream
Company operated stores and Licensed stores
The below provides a breakdown of Starbucks stores for both company operated and licensed stores
Americas
International
Total
So lets break the 15 834 company operated stores down in a bit more detail
Americas
- Company-operated stores 9,974 (55%)
- Licensed stores 8,093 (45%)
International
- Company-operated stores: 5 860 (44%
- Licensed stores: 7 329 (56%)
Total
- Company-operated stores: 15,834 (51%)
- Licensed stores: 15,422 (49%)
So lets break the 15 834 company operated stores down in a bit more detail
- U.S.: 8,791
- Canada: 1,175
- Siren Retail U.S: 8
- China: 4,123
- Japan: 1,379
- U.K.: 288
- All Other: 65
- Siren Retail International: 5
Sales mix of Starbucks company operated stores
Looking at the sales mix of Starbucks company operated stores we see that beverages makes up almost 75% of the total sales of Starbucks
- Beverages: 74%
- Food: 20%
- Packaged and single-serve coffees and teas: 1%
- Other :5%
Competition for Starbucks
Competition Our primary competitors for coffee beverage sales are specialty coffee shops. We believe that our customers choose among specialty coffee retailers primarily on the basis of product quality, service and convenience, as well as price. We continue to experience direct competition from large competitors in the quick-service restaurant sector and the ready-to-drink coffee beverage market, in addition to both well-established and start-up companies in many international markets. We also compete with restaurants and other specialty retailers for prime retail locations and qualified personnel to operate both new and existing stores. Our coffee and tea products sold through our Channel Development segment compete directly against specialty coffees and teas sold through grocery stores, warehouse clubs, specialty retailers, convenience stores and foodservice accounts and compete indirectly against all other coffees and teas on the market.
Trademarks and copyrights
Starbucks owns and has applied to register numerous trademarks and service marks in the U.S. and in other countries throughout the world. Some of our trademarks, including Starbucks, the Starbucks logo, Starbucks Reserve, Seattle’s Best Coffee, Teavana, Frappuccino and Starbucks VIA are of material importance. The duration of trademark registrations varies from country to country. However, trademarks are generally valid and may be renewed indefinitely as long as they are in use and/or their registrations are properly maintained. We own numerous copyrights for items such as product packaging, promotional materials, in-store graphics and training materials. We also hold patents on certain products, systems and designs. In addition, Starbucks has registered and maintains numerous Internet domain names, including “Starbucks.com,” “Starbucks.net,” “Starbucksreserve.com,” “Seattlesbest.com” and “Teavana.com.”
Seasonality and Quarterly Results
Our business is subject to moderate seasonal fluctuations, of which our fiscal second quarter typically experiences lower revenues and operating income. Additionally, as Starbucks Cards are issued to and loaded by customers during the holiday season, we tend to have higher cash flows from operations during the first quarter of the fiscal year. However, since revenues from Starbucks Cards are recognized upon redemption and not when cash is loaded onto the Card, the impact of seasonal fluctuations on the consolidated statements of earnings is much less pronounced. As a result of moderate seasonal fluctuations, results for any quarter are not necessarily indicative of the results that may be achieved for the full fiscal year.
Our business is subject to moderate seasonal fluctuations, of which our fiscal second quarter typically experiences lower revenues and operating income. Additionally, as Starbucks Cards are issued to and loaded by customers during the holiday season, we tend to have higher cash flows from operations during the first quarter of the fiscal year. However, since revenues from Starbucks Cards are recognized upon redemption and not when cash is loaded onto the Card, the impact of seasonal fluctuations on the consolidated statements of earnings is much less pronounced. As a result of moderate seasonal fluctuations, results for any quarter are not necessarily indicative of the results that may be achieved for the full fiscal year.
Starbucks (SBUX) stock performance
The following graph depicts the total return to shareholders from September 28, 2014 through September 29, 2019, relative to the performance of the Standard & Poor’s 500 Index, the NASDAQ Composite Index and the Standard & Poor’s 500 Consumer Discretionary Sector, a peer group that includes Starbucks. All indices shown in the graph have been reset to a base of 100 as of September 28, 2014, and assume an investment of $100 on that date and the reinvestment of dividends paid since that date. The stock price performance shown in the graph is not necessarily indicative of future price performance.
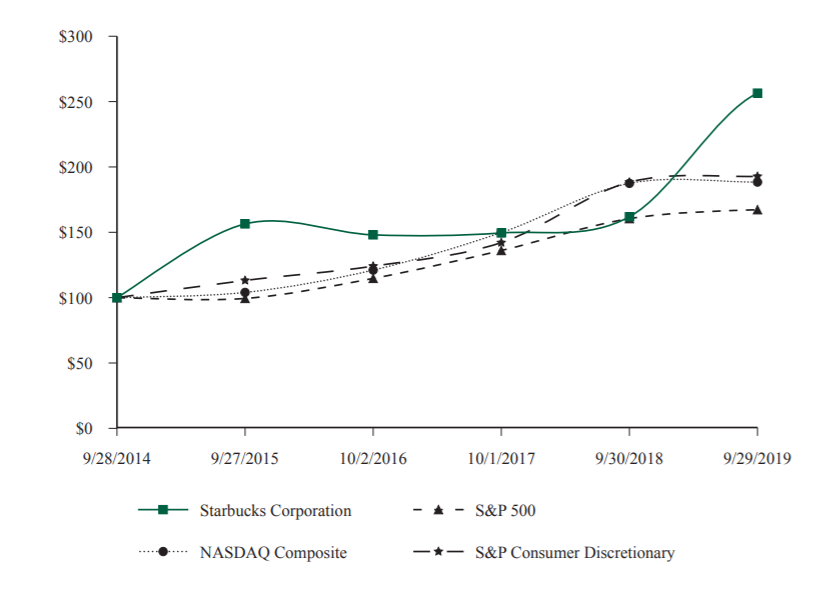
Starbucks vs S&P 500 vs Nasdaq vs S&P consumer discretionary
A $100 invested at the end of September 2014 would have resulted in an investment worth $256.48 as at the end of September 2019. That is an annual growth rate of 20.79% over the last 5 years, which is extraordinary returns provided to stockholders, this while the S&P 500 provided an average annual return of 10.84%. So the stock of Starbucks has grown at 1.92 times that of the S&P 500.
Our last Starbucks (SBUX) stock valuation as at 29 April 2020
So based on Starbucks (SBUX) latest earnings report and their fiscal guidance what do we value the stock of Starbucks at? Based on their earnings report and their withdrawal of their fiscal guidance and predicted impact of Coronavirus on their earnings our valuation model provides a target price (full value price) for Starbucks (SBUX) at $61.90 a stock (down slightly from our 1st quarter 2020 earnings report valuation of Starbucks). We therefore believe the stock of Starbucks is overvalued
We recommend that long term fundamental and value investors look to enter a stock at least 10% below our target (full value) price which in this case is $61.90. A good entry point into Starbucks would therefore be at $55.70 or below.
We expect the stock of Starbucks to pull back from current levels to levels closer to our target price (full value price) in coming weeks and months.