
|
Related Topics
|
|
Category: NASDAQ, Dow Jones and S&P 500
Date: 9 September 2020 We take a look at the recent underperformance of the NASDAQ compared to the Dow Jones and S&P500 following years of it outperforming the Dow and the S&P500. Tech stocks seems to be out of favor and sector rotation is taking place out of lofty valued tech stocks and the bubble of all bubbles, Tesla (TSLA) stock has been declining strongly in recent days following the fact that it was not included in the S&P 500
|

|
|
Our YouTube channel is now live. Watch short summary videos of our articles
So while the Nasdaq has been underperforming the Dow Jones and the S&P500 over the very recent past. It has still easily outperformed the Dow Jones and the S&P500 over the last year, 5 years and 10 year period. "
The performance of Nasdaq, Dow Jones and S&P on a chart
The interactive chart below shows the performance of the Dow over the last month. As soon as user clicks on the Nasdaq and S&P 500 at the top right of the graphic these indices are added to the chart and the chart calculates the returns provided over the last month. Users can then select predetermined time frames under the zoom box or add their own dates within the last 10 years and the chart will recalculate the returns based on the dates selected.
Nasdaq, Dow Jones and S&P performance over various time periods
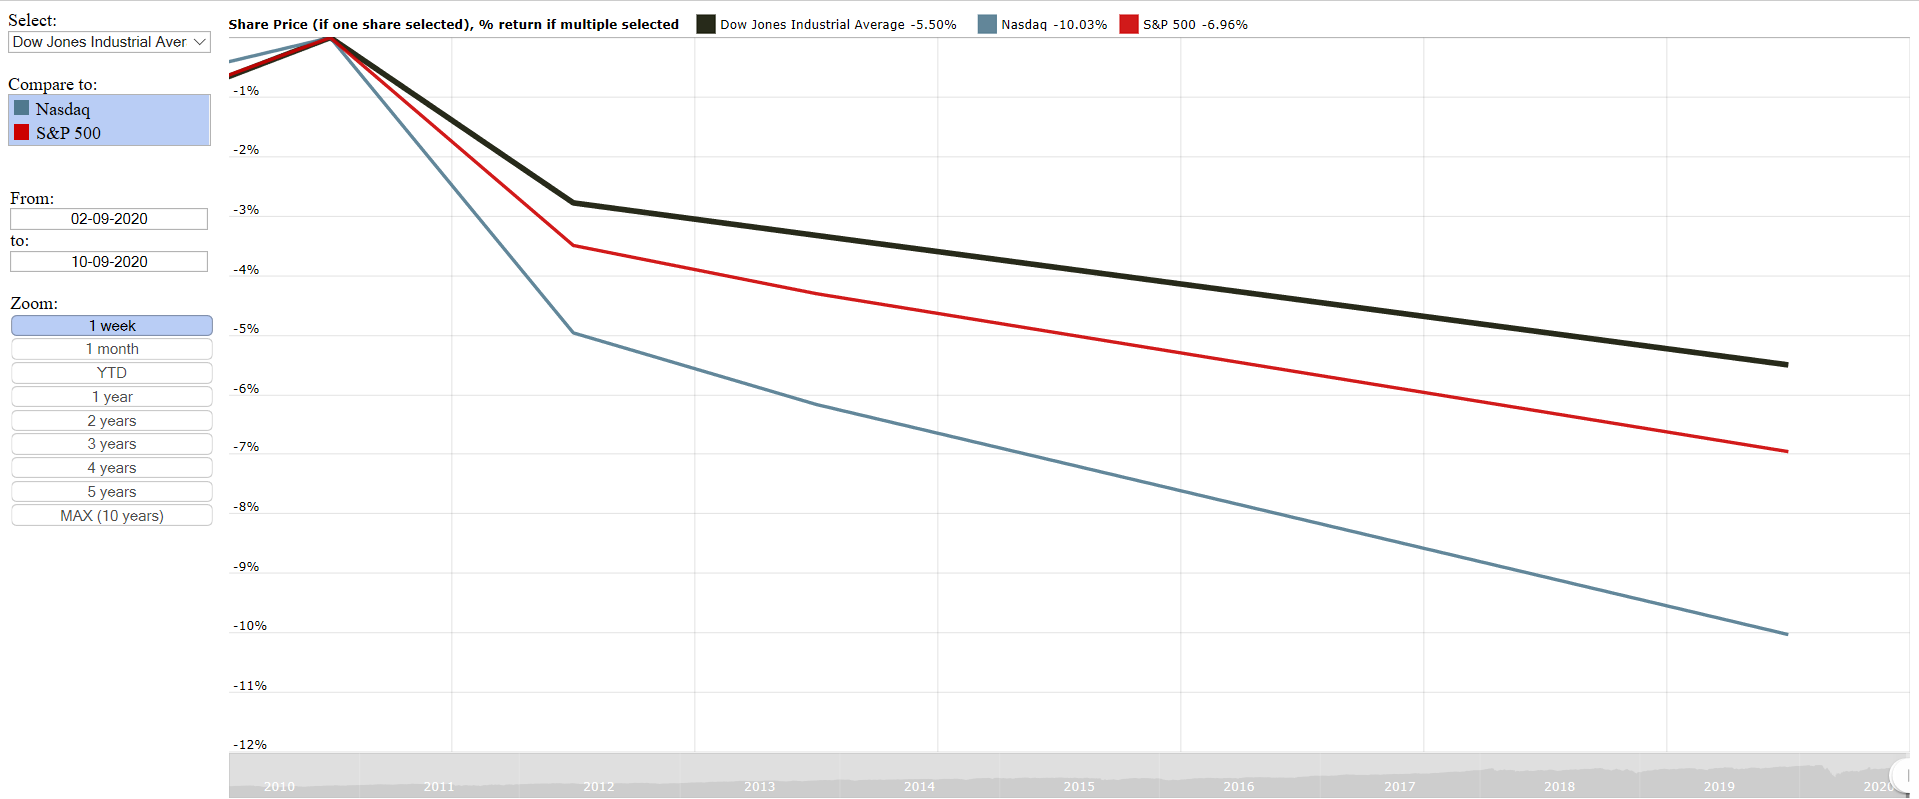
1 weekThe summary and the graphic below shows the performance of the Nasdaq, Dow Jones and S&P 500 over the last week
|
2 weeksThe summary and the graphic below shows the performance of the Nasdaq, Dow Jones and S&P 500 over the last 2 weeks
|
The summary below shows the return of the Dow Jones, Nasdaq and S&P 500 over the last 2 weeks:
|
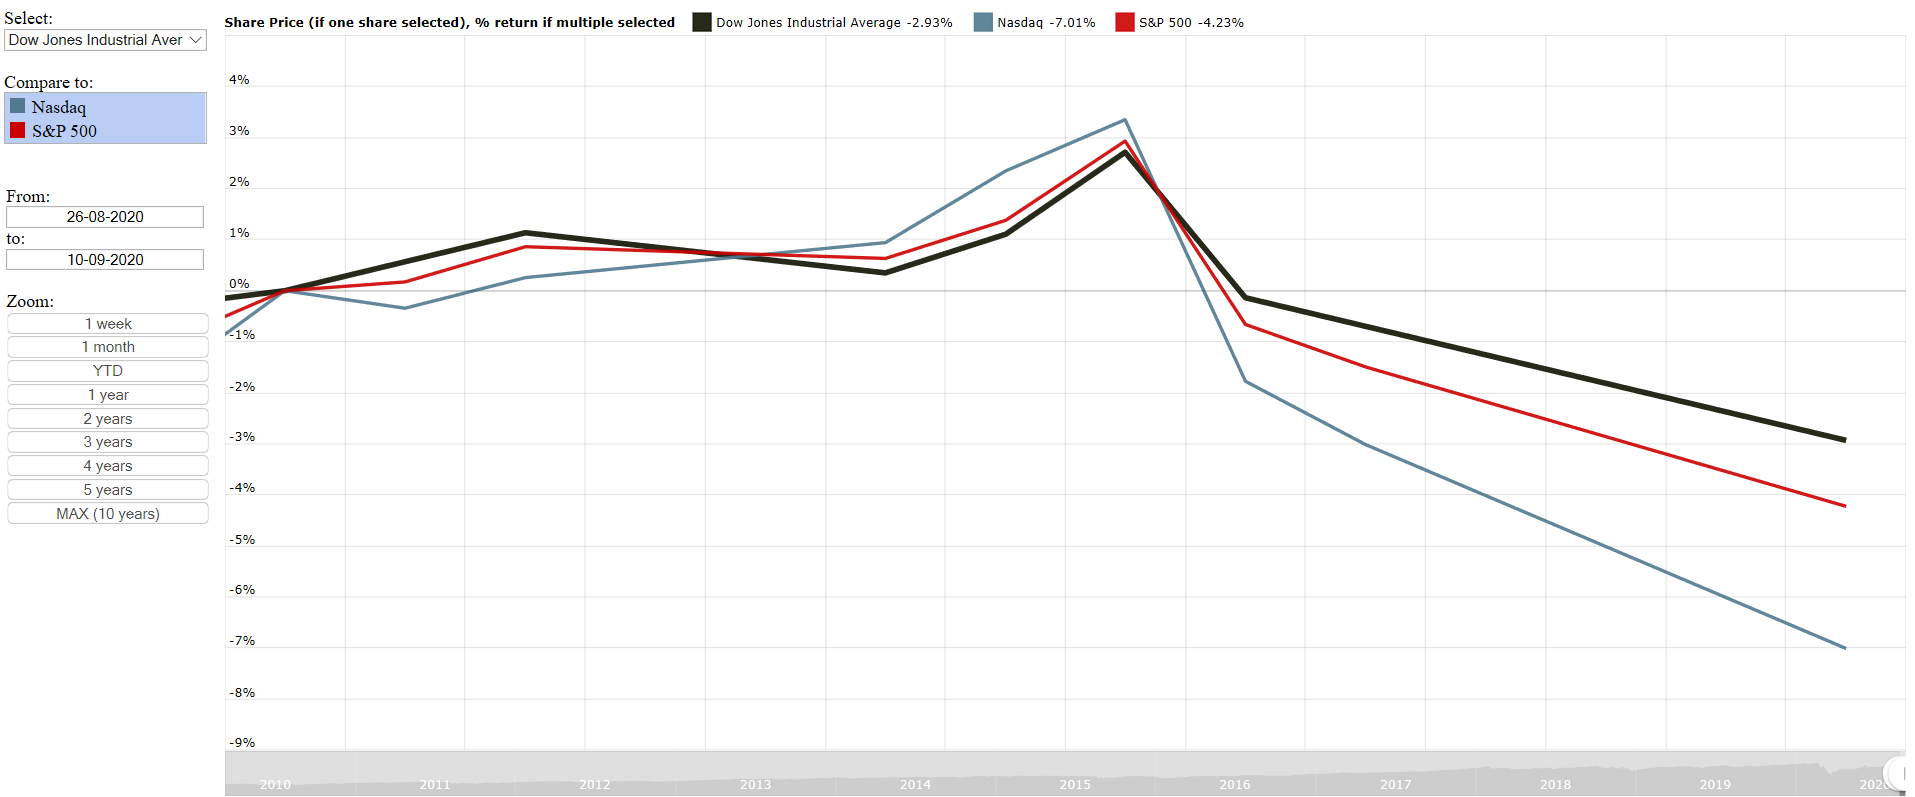
The summary below shows the return of the Dow Jones, Nasdaq and S&P 500 over the last 2 weeks:
|
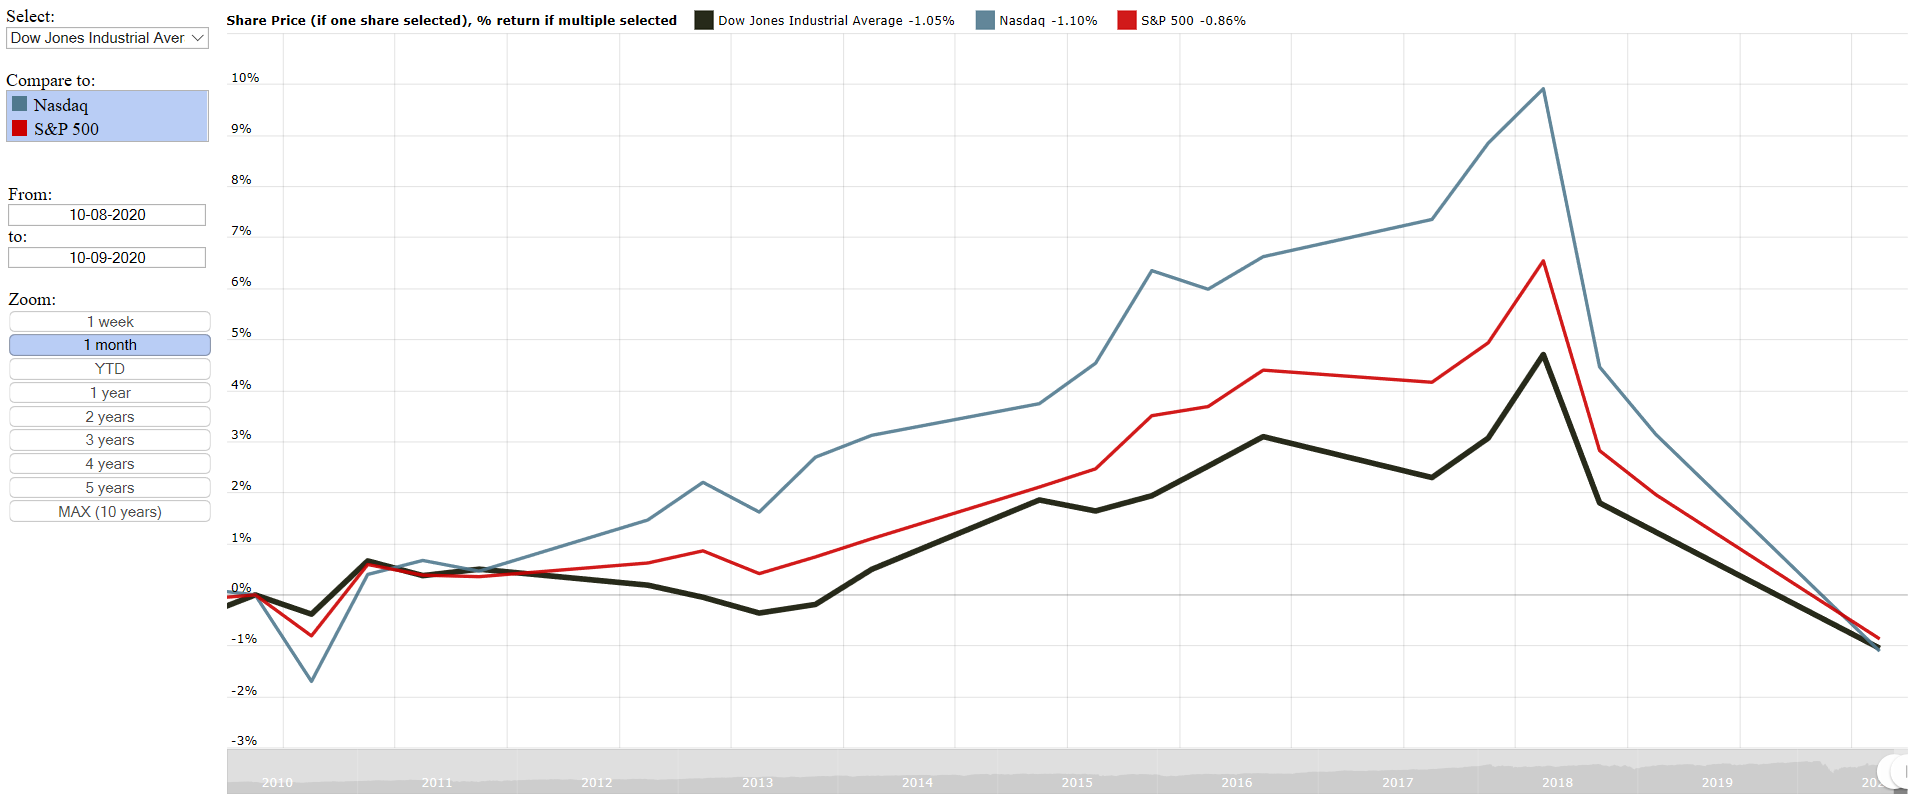
1 month |
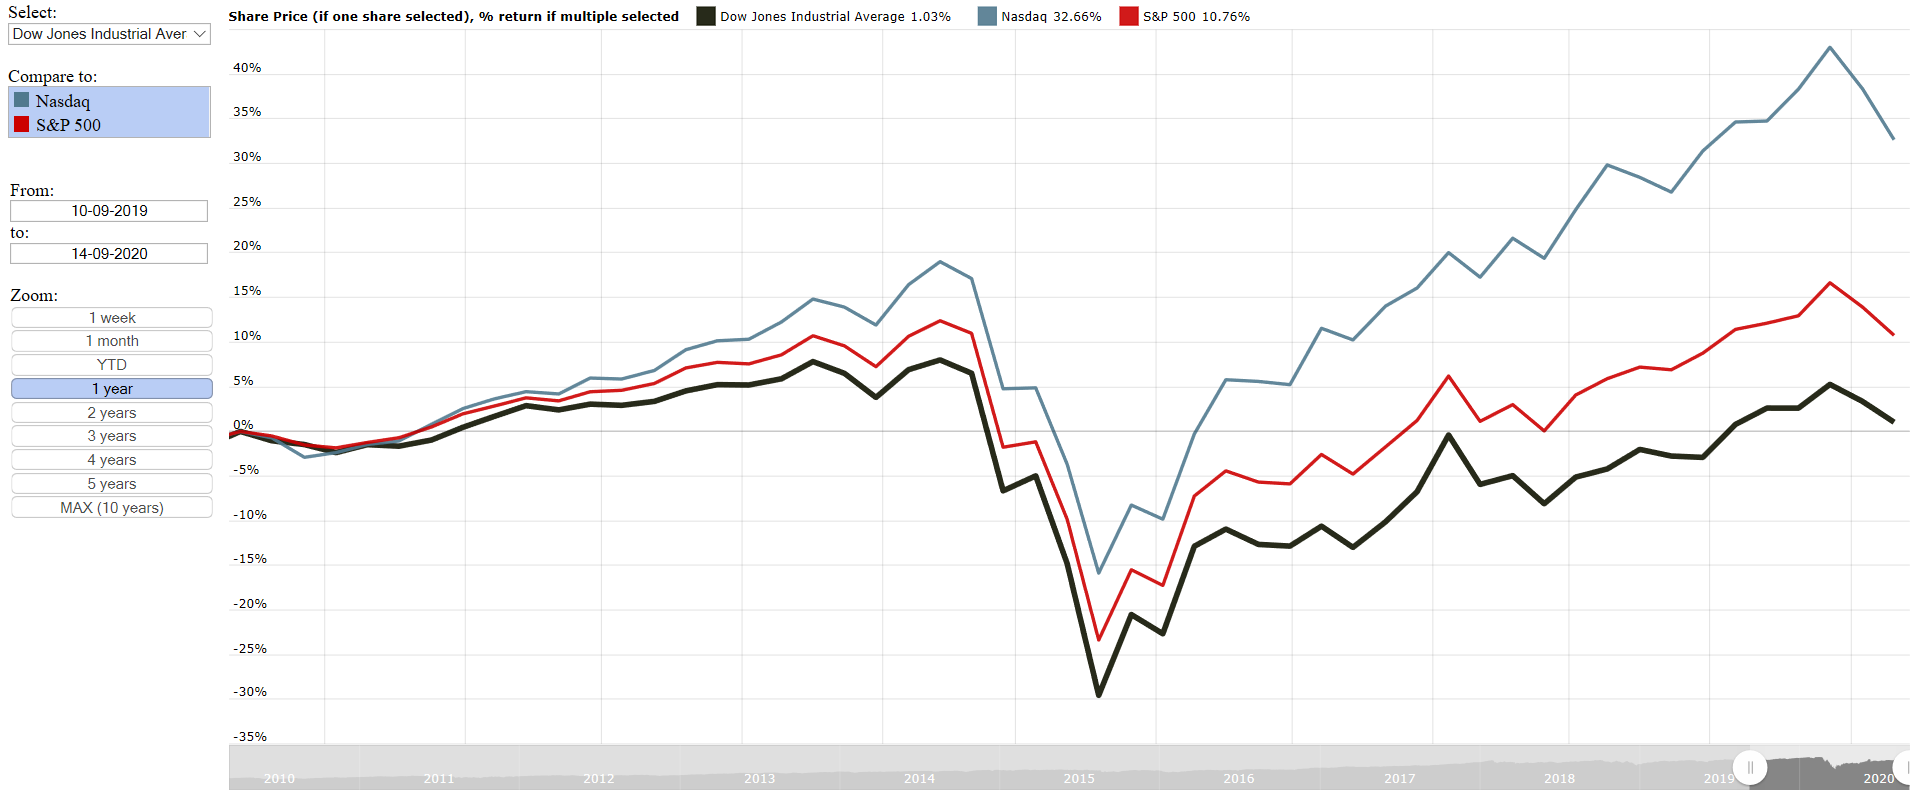
1 Year |
|
The summary and the graphic below shows the performance of the Nasdaq, Dow Jones and S&P 500 over the last week
|
The summary and the graphic below shows the performance of the Nasdaq, Dow Jones and S&P 500 over the last year
|
|
|
|
The summary below shows the return of the Dow Jones, Nasdaq and S&P 500 over the last month:
|
The summary below shows the return of the Dow Jones, Nasdaq and S&P 500 over the last year:
|
So while the Nasdaq has been under performing the Dow Jones and the S&P500 over the very recent past. It has still easily outperformed the Dow Jones and the S&P500 over the last year, 5 years and 10 year period. Over the last 10 years the Nasdaq has provided a return of 352.4%, the S&P 500 has provided 184.8% and the Dow Jones 153.3%. So basically the Nasdaq has provided over double the returns of the Dow Jones over the last 10 years. So while over the shorter term the tech heavy Nasdaq is declining faster than the Dow Jones and the S&P500 it has easily outperformed them due to the very fact that it is tech heavy as tech stocks has had a very good decade.
Related Topics