|
Related Topics
|
|
Category: Stock Market and NetApp
Date: 18 September 2019 Stock Price: $56.54 We take a look at the 1st quarter earnings release of their 2020 fiscal year of NetApp the software and systems developer and data storage firm.
|

|
About NetApp
Throughout the world, leading organizations count on NetApp for software, systems and services to store, manage, protect, and retain one of their most precious assets: their data. We enable enterprises, service providers and partners to envision, deploy, and evolve their IT environments. Customers benefit from our open collaboration with other technology leaders to create the specific solutions they need. We were incorporated in 1992 and created the world’s first networked storage appliance. Today, we offer a portfolio of products and services that satisfy a broad range of customer workloads across different data types and deployment models.
Overview of NetApp's latest earnings report
The numbers we are interested in (for the quarter):
- Total revenue: $1.236 billion (down from $1.474 billion from the same quarter of the previous year)
- Revenues decreased by -16.1% over the last 12 months
- Cost of Revenues: $420 million (down from $511 million for the same quarter of the previous year)
- Cost of revenues decreased by -17.8% over the last 12 months
- Net income: $103 million (down from $283 million loss for the same quarter of the previous year)
- Diluted earnings per share: $0.42 (down from $1.05 for the same quarter of the previous year)
- Dividends declared: $0.48 (up from $0.40 for the same quarter of the previous year)
- Dividend yield: 3.39% (assuming this quarter's dividend is paid each quarter of the fiscal year)
- Diluted weighted-average shares outstanding: 243 million (down from 269 million for the same quarter of the previous year)
- Cash and cash equivalents: $3.532 billion
- Cash and cash equivalents per share: $14.54
- Cash and cash equivalents makes up 25.7% of NetApp's market capital
- Cash and cash equivalents makes up 45.2% of NetApp's total assets
- Stockholders equity: $863 million
- Stockholders equity per NetApp stock:$3.55
- NetApp is trading at 15.93 times its stockholders equity per share
- Cash generated from operations: $103 million
- Cash generated from operations per share: $0.42
NetApp's management commentary on the results and earnings guidance
SUNNYVALE, Calif.—August 14, 2019—NetApp (NASDAQ: NTAP) today reported financial results for the first quarter of fiscal year 2020, which ended on July 26, 2019.
“I am clearly disappointed with our Q1 top line results but remain confident in our strategy and the fundamentals of our business model. The gross margin and cost structure improvements we’ve made provide support for our free cash flow generation and enable us to navigate the ongoing macroeconomic headwinds while making the strategic moves that position us well to return to growth,” said George Kurian, chief executive officer. “We consistently receive positive feedback from our customers and partners on the value of our Data Fabric strategy and the strong performance of our best teams demonstrates our ability to capitalize on this strength.”
Second Quarter of Fiscal Year 2020 Financial Outlook
The Company provided the following financial guidance for the second quarter of fiscal year 2020:
Full Fiscal Year 2020 Financial Outlook
The Company updated the following financial guidance for the full fiscal year 2020:
Dividend
The next cash dividend of $0.48 per share will be paid on October 23, 2019, to shareholders of record as of the close of business on October 4, 2019.
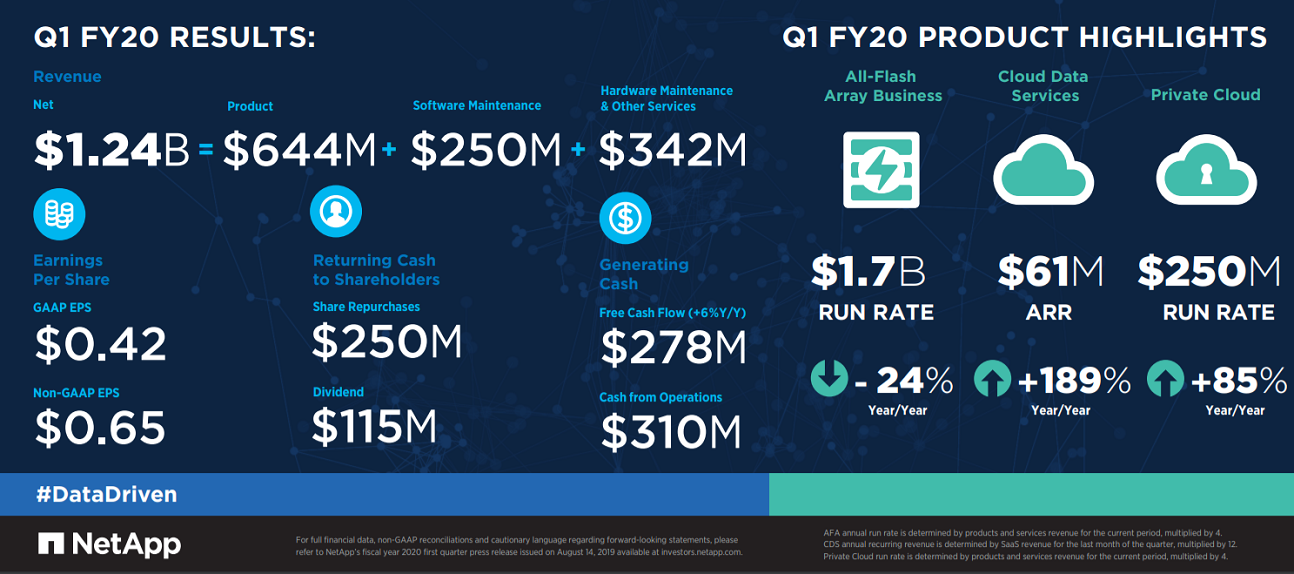
The image below shows Q1 FY2020 highlights for NetApp
“I am clearly disappointed with our Q1 top line results but remain confident in our strategy and the fundamentals of our business model. The gross margin and cost structure improvements we’ve made provide support for our free cash flow generation and enable us to navigate the ongoing macroeconomic headwinds while making the strategic moves that position us well to return to growth,” said George Kurian, chief executive officer. “We consistently receive positive feedback from our customers and partners on the value of our Data Fabric strategy and the strong performance of our best teams demonstrates our ability to capitalize on this strength.”
Second Quarter of Fiscal Year 2020 Financial Outlook
The Company provided the following financial guidance for the second quarter of fiscal year 2020:
- Net revenues are expected to be in the range of: $1.325 billion to $1.475 billion
- Earnings per share is expected to be in the range of:
- GAAP: $0.86-$0.94
- Non-GAAP: $0.91-$0.99
Full Fiscal Year 2020 Financial Outlook
The Company updated the following financial guidance for the full fiscal year 2020:
- Net revenues are expected to decline 5% - 10% year-over-year
- Consolidated gross margins are expected to be:
- GAAP: 65%-66%
- Non-GAAP:66%-67%
- Operating margins are expected to be in the range of:
- GAAP: 16%-19%
- Non-GAAP:19%-22%
- Effective tax rate is expected to be:
- GAAP: 19%-20%
- Non-GAAP: 18%-19%
Dividend
The next cash dividend of $0.48 per share will be paid on October 23, 2019, to shareholders of record as of the close of business on October 4, 2019.
The image below shows Q1 FY2020 highlights for NetApp
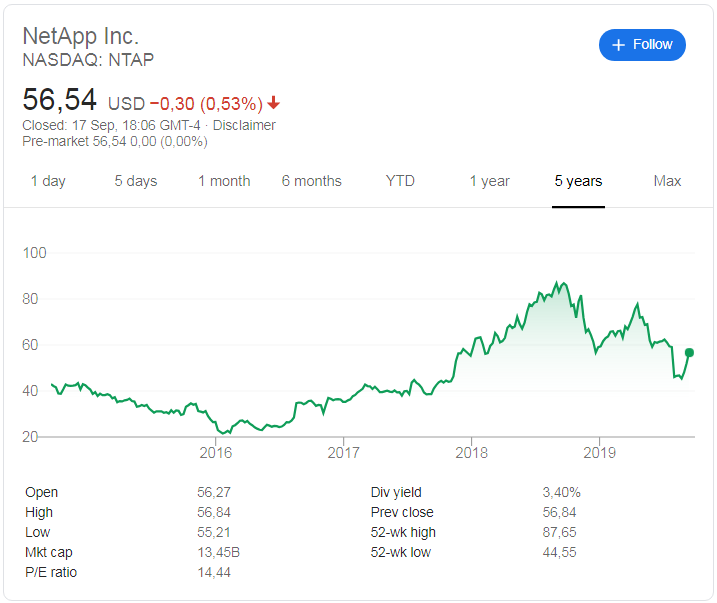
NetApp (NASDAQ:NTAP) stock price history
The image below, obtained from Google, shows the stock price history of NetApp (NASDAQ: NTAP) for the last 5 years. And its been an a relatively good time for NetApp stockholders. 5 years ago the stock was trading at around $43 a share, and its currently trading at $56.54. Thats a decent stock price return of 31.4% over the last 5 years. While its not a bad return the opportunity cost of holding NetApp stock instead of some of the others we recently valued that showed stock price returns of well above 100% over a 5 year period is significant. NTAP is trading at a lot closer to its 52 week low than it is to its 52 week high, which shows that short term sentiment and momentum of NetApp stock is negative.
Recent coverage NetApp
The extract below discusses NetApp at more detail, as obtained from Zacks.
It has been about a month since the last earnings report for NetApp (NTAP - Free Report) . Shares have added about 21.3% in that time frame, outperforming the S&P 500. Will the recent positive trend continue leading up to its next earnings release, or is NetApp due for a pullback? Before we dive into how investors and analysts have reacted as of late, let's take a quick look at the most recent earnings report in order to get a better handle on the important catalysts.
NetApp Q1 Earnings & Revenues Tops Estimates
NetApp reported first-quarter fiscal 2020 non-GAAP earnings of 65 cents per share, surpassing the Zacks Consensus Estimate by 8 cents. However, the figure declined 37.5% from the year-ago quarter. Nonetheless, earnings exceeded management’s revised guided range of 55 cents to 60 cents per share.
Revenues of $1.236 billion marginally beat the consensus estimate of $1.23 billion. However, the figure declined 16.1% from the year-ago quarter. Nonetheless, the top line came marginally ahead of the revised guided range of $1.22-$1.23 billion. The year-over-year decline includes negative impact of around one point of exchange rate fluctuations.
Q2 View
NetApp anticipates non-GAAP earnings for second-quarter fiscal 2020 between 91 cents and 99 cents per share. Moreover, net revenues are anticipated to be in the range of $1.325-$1.475 billion.
Read the full article here
NetApp (NASDAQ: NTAP) latest stock valuation
So based on the earnings report of NetApp (NASDAQ: NTAP) and what do we value NetApp (NTAP) stock at? Based on the earnings reported and the fiscal guidance provided by the group our valuation model provides a target (full value) price for NetApp at $57.60 a stock. We therefore believe the NetApp is fully valued and would not advise long term fundamental or value investors buy into NetApp stock at its current price. Rather look to get into NetApp at least 10% below our target (full value) price of $57.60. A good entry point would therefore be at or $51.90 or below.