
|
Related Topics
|
|
Category: Norwegian Cruise Line Holdings (NCLH) vs Royal Caribbean Cruises (RCL)
Date: 26 July 2020 Stock price of Norwegian Cruise Line: $14.38 Stock price of Royal Caribbean: $50.83 In our continued stock comparison articles we compare the stock of cruise ship operators Norwegian Cruise Line Holdings (NCLH) and Royal Caribbean Cruises (RCL). We compare their stock price performance as well as earnings reports in order to determine who comes out on top and who is best placed to outperform in coming years.
|

|
So is there any particular reason why the stock of Norwegian Cruise Line Holdings has underperformed significantly against Royal Caribbean Cruises? And does the bigger stock price decline in Norwegian Cruise Lines (NCLH) provide a better buying opportunity than that of Royal Caribbean Cruises?"
More About Norwegian Cruise Line Holdings (NCLH)
Norwegian Cruise Line Holdings Ltd. (NYSE: NCLH) is a leading global cruise company which operates the Norwegian Cruise Line, Oceania Cruises and Regent Seven Seas Cruises brands. With a combined fleet of 28 ships with approximately 59,150 berths, these brands offer itineraries to more than 490 destinations worldwide. The Company will introduce nine additional ships through 2027.
Overview of NCLH latest earnings report
Overview of NCLH latest earnings report
- Total revenue: $1.246 billion (down from $1.403 billion for the same quarter of the previous year)
- Total revenue decreased by-11.2% over the last 12 months
- Total cruise operating expenses: $994.260 million (up from $826.651 million for the same quarter of the previous year)
- Total cruise operating expenses increased by 20.2% over the last 12 months
- The above shows the trouble that Norwegian Cruise Lines are in. Revenues declined by over 10% while operating costs increased by over 20%
- Net loss: -$1.888 billion (down from $118.157 million profit for the same quarter of the previous year)
- Diluted loss per share: -$8.80 (down from $0.54 for the same quarter of the previous year)
- PE ratio of Norwegian Cruise Line Holdings: Since the group is currently loss making a PE ratio cannot be calculated
- Diluted number of shares in issue: 213.630 million (down from 218.873 million for the same quarter of the previous year)
- Cash and cash equivalents: $1.360 billion
- Cash and cash equivalents per share: $6.36
- Cash and cash equivalents makes up 38.7% of Norwegian Cruise Line Holdings market capital
- Cash and cash equivalents makes up 8.3% of Norwegian Cruise Line Holdings total assets
- Cash and cash equivalents per share: $6.36
- Trade names of Norwegian Cruise Line Holdings: $500.5 million
- Trade names worth per Norwegian Cruise Line Holdings stock: $2.34
- Trade names makes up 3% of Norwegian Cruise Line Holdings' total assets
- Trade names worth per Norwegian Cruise Line Holdings stock: $2.34
- Stockholders equity in Norwegian Cruise Line Holdings: $4.374 billion
- Stockholders equity per share: $20.47
- Norwegian Cruise Line Holdings is trading at 0.81 times its stockholders equity per share which is well outside the expected range of between 2 and 4 times that most firms tend to trade at
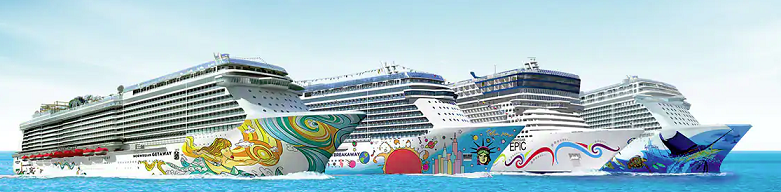
A sketch of 4 of Norwegian Cruise Line Holdings cruise ships
More About Royal Caribbean Cruises (RCL)
Royal Caribbean Cruises Ltd. (NYSE: RCL) is a global cruise vacation company that controls and operates four global brands: Royal Caribbean International, Celebrity Cruises, Azamara and Silversea Cruises. We are also a 50% joint venture owner of the German brand TUI Cruises and a 49% shareholder in the Spanish brand Pullmantur Cruceros. Together these brands operate a combined total of 61 ships with an additional 17 on order as of December 31, 2019. They operate diverse itineraries around the world that call on all seven continents.
Overview of Royal Caribbean Cruises latest earnings report (values and ratios as at time of reporting)
Overview of Royal Caribbean Cruises latest earnings report (values and ratios as at time of reporting)
- Revenue: $2.032 billion (down from $2.439 billion for the same quarter of the previous year)
- Revenues decreased by -16.7% over the last 12 months
- Total cruise operating expenses: $1.510 billion (up from $1.413 billion for the same quarter of the previous year)
- Total cruise operating expenses increased by 6.9% over the last 12 months
- Significant margin squeeze being experienced by Royal Caribbean Cruises with its costs and expenses growing while revenues declined
- Net loss: -$1.44 billion (down from $249 million for the same quarter of the previous year)
- Diluted loss per share: -$6.91 (down from $1.19 profit for the same quarter of the previous year)
- Diluted number of shares outstanding: 209.097 million (down from 209.874 million for the same quarter of the previous year)
- Cash and cash equivalents: $3.890 billion
- Cash and cash equivalents per share: $18.60
- Cash and cash equivalents makes up 46.2% of the group's market capital
- Cash and cash equivalents makes up 11.6% of the group's total assets
- Cash and cash equivalents per share: $18.60
- Accounts receivable: $220.876 million
- Accounts receivable makes up 0.6% of total assets
- Property and equipment: $25.857 billion
- Property and equipment makes up 77.3% of Royal Caribbean Cruises
- Stockholders equity in Royal Caribbean Cruises: $10.231 billion
- Stockholders equity per share: $48.92
- So Royal Caribbean Cruises is trading at 0.82 times its stockholders equity per share which is outside the expected range of between 2 and 4 times that most firms tend to trade at
- Cash generated from operations for the fiscal year: $198.710 million
- Cash generated from operations per share: $0.95
Norwegian Cruise Line Holdings (NCLH) stock vs Royal Caribbean Cruises (RCL) stock
The image below shows the stock price performance of Norwegian Cruise Line Holdings (NCLH) and Royal Caribbean Cruises (RCL) over the last 5 years. Both Norwegian Cruise Line Holdings (NCLH) and Royal Caribbean Cruises (RCL) are active in the cruise ship industry and as the image below shows both stocks have taken a pounding since the start of 2020. Over the 5 year period the two firms provided the following returns to stockholders (sorted from best to worst)
- Royal Caribbean Cruises (RCL): -41.77%
- Norwegian Cruise Line Holdings (NCLH) -74.77%
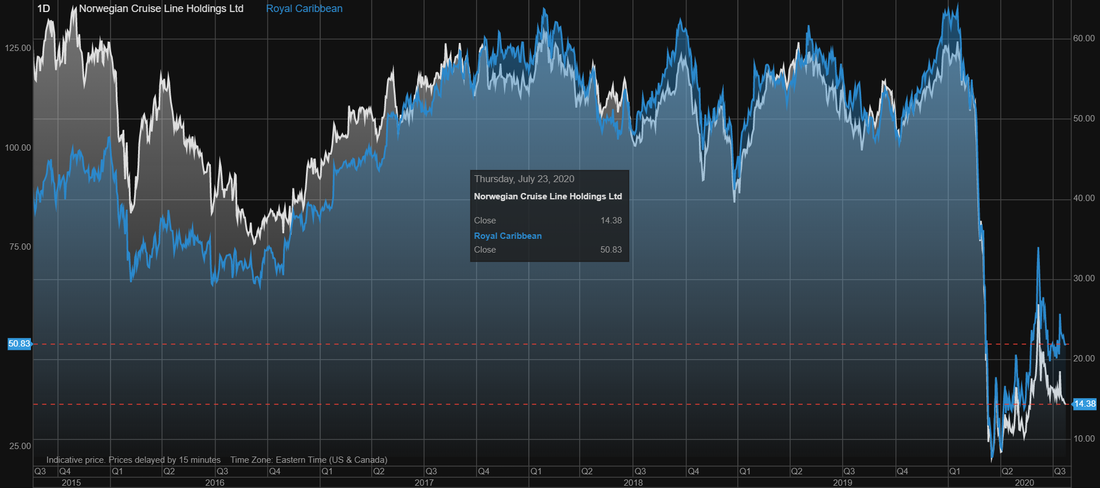
Norwegian Cruise Line Holdings (NCLH) stock vs Royal Caribbean Cruises (RCL) stock performance over the last 5 years
So is there any particular reason why the stock of Norwegian Cruise Line Holdings has underperformed significantly against Royal Caribbean Cruises? And does the bigger stock price decline in Norwegian Cruise Lines (NCLH) provide a better buying opportunity than that of Royal Caribbean Cruises? Below we take a look at some of the fundamentals underpinning these two stocks
So who is best positioned for future stock price growth? Norwegian or Royal Caribbean
One of our key metrics is the Price to Stockholders equity per share ratio. When looking at this we find the following:
Based on this metric Norwegian Cruise Line offers far more value than Royal Caribbean. Most firms tend to trade at a ratio of between 2 and 4 times its stockholders equity per share. What it shows that if a firm was to be liquited now, all assets sold, liabilities paid and the rest paid out to stockholders, that amount is expressed as a ratio to the stock price. So for Norwegian the stock price is 0.72 times the value of what investors would get out if they were liquidated. For Royal Caribbean the stock price is 1.04 times what will be paid out of they were liquidated. Thus if both were liquidated investors stand to lose money if they own Royal Caribbean and set to make some money if they owned Norwegian.
Next up cash as percentage of stock price:
Next up lets take a look at the percentage cash on the balance sheet makes up of each group's total assets:
- Price/Stockholders equity per share for Norwegian Cruise Line Holdings: 0.72
- Price/Stockholders equity per share for Royal Caribbean Cruises : 1.04
Based on this metric Norwegian Cruise Line offers far more value than Royal Caribbean. Most firms tend to trade at a ratio of between 2 and 4 times its stockholders equity per share. What it shows that if a firm was to be liquited now, all assets sold, liabilities paid and the rest paid out to stockholders, that amount is expressed as a ratio to the stock price. So for Norwegian the stock price is 0.72 times the value of what investors would get out if they were liquidated. For Royal Caribbean the stock price is 1.04 times what will be paid out of they were liquidated. Thus if both were liquidated investors stand to lose money if they own Royal Caribbean and set to make some money if they owned Norwegian.
Next up cash as percentage of stock price:
- Cash as percentage of stock price for Norwegian Cruise Line Holdings: 42.8%
- Cash as percentage of stock price for Royal Caribbean Cruises: 36.6%
Next up lets take a look at the percentage cash on the balance sheet makes up of each group's total assets:
- Cash as percentage of stock price for Norwegian Cruise Line Holdings: 8.3%
- Cash as percentage of stock price for Royal Caribbean Cruises: 11.6%
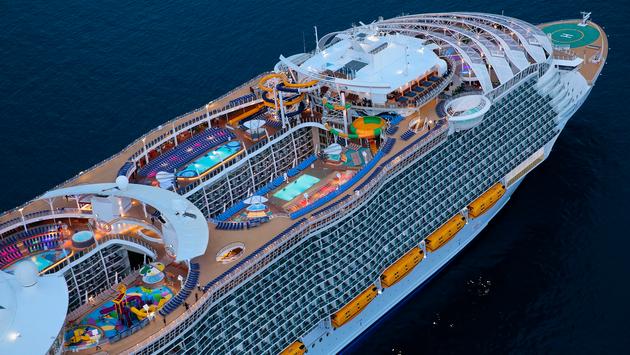
Royal Caribbean Cruise Ship
So taking all the above into consideration who comes out on top? While Norwegian Cruise Line wins on the first metric we looked at they have a far weaker cash as percentage of total assets position than Royal Caribbean Cruises, which means they have less cash to ride out the current difficult operating environment. So Norwegian is more likely to issue stock or take on debt to stay afloat than Royal Caribbean Cruises and we believe this is the main reason the stock of Norwegian Cruise Line Holdings has underperformed significantly against Royal Caribbean in recent months.
And it is because of this that we rate the stock of Royal Caribbean Cruises as the WINNER in the battle of cruise liners
And it is because of this that we rate the stock of Royal Caribbean Cruises as the WINNER in the battle of cruise liners