|
Related Topics
|
|
Category: Stock Market and Procter & Gamble
Date: 22 October 2019 Stock Price: $123.55 We take a look at the latest earnings report for the 1st quarter of their 2020 financial year of Procter & Gamble a company that serves consumers with global leading brands such as Ariel, Gillette and Pampers.
|
|
About Procter & Gamble
P&G serves consumers around the world with one of the strongest portfolios of trusted, quality, leadership brands, including Always®, Ambi Pur®, Ariel®, Bounty®, Charmin®, Crest®, Dawn®, Downy®, Fairy®, Febreze®, Gain®, Gillette®, Head & Shoulders®, Lenor®, Olay®, Oral-B®, Pampers®, Pantene®, SK-II®, Tide®, Vicks®, and Whisper®. The P&G community includes operations in approximately 70 countries worldwide
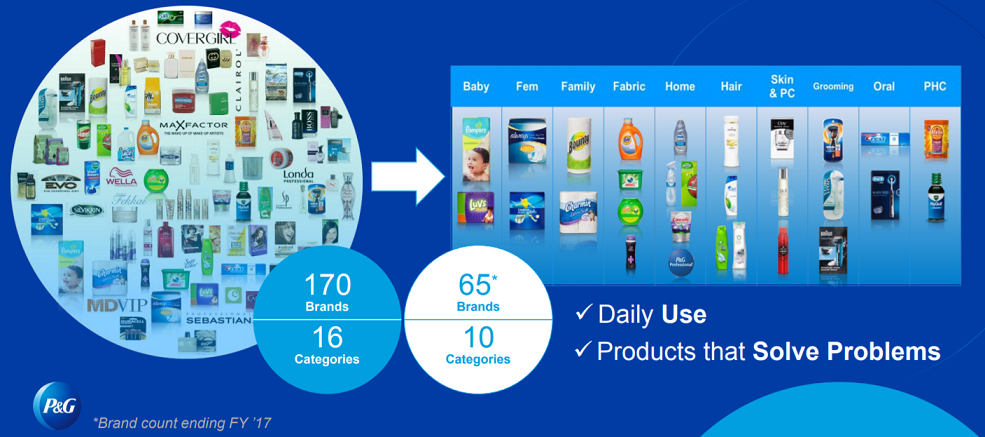
Procter & Gamble brands
Financial overview of Procter & Gamble's 1st quarter 2020 earnings report
The numbers below refers to the latest quarter unless specified otherwise
- Net sales: $17.789 billion (up from $16.690 billion for the same quarter of the previous year)
- Net sales increased by 7% over the last 12 months
- Cost of products sold: $8.723 billion (up from $8.484 billion for the same quarter of the previous year)
- Cost of products sold increased by 3% over the last 12 months
- Net Income: $3.593 billion (up from $3.199 billion for the same quarter of the previous year)
- Diluted earnings per share: $1.36 (up from $1.22 for the same quarter of the previous year)
- Weighted average number of shares - diluted: 2.647 billion (up from 2.612 billion for the same quarter of the previous year)
- Cash and cash equivalents: $9.304 billion
- Cash and cash equivalents per share: $3.51
- Cash and cash equivalents makes up 2.84% of Procter & Gamble's market capital
- Cash and cash equivalents makes up 3.15% of Procter & Gamble's total assets
- Inventories: $5.465 billion
- Inventories makes up 4.79% of Procter & Gamble's total assets
- Goodwill: $39.6 billion
- Goodwill per share: $14.96
- So essentially 12.1% of Procter & Gamble's stock price is made up by goodwill
- Goodwill makes up 34.7% of Procter & Gamble's total assets
- Basically the group is saying that their brand names are worth $39.6 billion, or $14.96 per share
- Stockholders' equity in Procter & Gamble : $46.984 billion
- Stockholders equity per share: $17.74
- So Procter & Gamble is trading at 6.69 times its stockholders equity per share, which is well outside the expected range of between 2 and 4 times that most firms tend to trade at.
- Cash generated from operations: $4.169 billion
- Cash generated from operations per share: $1.57
Procter & Gamble's management commentary on the earnings and fiscal guidance
CINCINNATI--(BUSINESS WIRE)-- The Procter & Gamble Company (NYSE:PG) reported first quarter fiscal year 2020 net sales of $17.8 billion, an increase of seven percent versus the prior year. Excluding the net impacts of foreign exchange, acquisitions and divestitures, organic sales also increased seven percent. Diluted net earnings per share were $1.36, up 11% versus the prior year. Core earnings per share increased 22% to $1.37. Currency-neutral core EPS increased 24% versus the prior year.
Operating cash flow was $4.2 billion for the quarter. Adjusted free cash flow productivity was 91%. The Company returned $4.9 billion of cash to shareholders via $1.9 billion of dividend payments and $3 billion of common stock repurchases.
“We delivered strong top-line growth, profit margin expansion and cash productivity in the first quarter, enabling us to increase our outlook for fiscal year results,” said David Taylor, Chairman, President and Chief Executive Officer. “We will continue executing our strategies of superiority, productivity, constructive disruption and improving P&G’s organization and culture to deliver balanced top-line and bottom-line growth along with strong cash generation in a challenging competitive and macroeconomic environment.”
Fiscal Year 2020 Guidance
The Company raised its outlook for fiscal 2020 all-in sales growth from a range of three to four percent to a range of three to five percent growth versus the prior fiscal year. This estimate includes a modest negative impact from foreign exchange, largely offset by a modest positive impact from acquisitions and divestitures. The Company increased its guidance for organic sales growth from a range of three to four percent to a range of three to five percent growth.
The Company increased its guidance range for fiscal 2020 all-in GAAP diluted net earnings per share growth to 225% to 243%, noting that the comparison period is significantly depressed by the Gillette Shave Care impairment adjustments in fiscal 2019. P&G raised its fiscal 2020 guidance for core earnings per share growth from a range of four to nine percent to a range of five to ten percent growth versus fiscal 2019.
The Company is not able to reconcile its forward-looking non-GAAP cash flow measure without unreasonable efforts because the Company cannot predict the timing and amounts of discrete cash items, such as acquisitions, divestitures, or impairments, which could significantly impact GAAP results. The Company increased its estimate for fiscal 2020 adjusted free cash flow productivity from 90% to 95%. The Company expects to pay over $7.5 billion in dividends and repurchase $6 billion to $8 billion of common shares in fiscal 2020.
Operating cash flow was $4.2 billion for the quarter. Adjusted free cash flow productivity was 91%. The Company returned $4.9 billion of cash to shareholders via $1.9 billion of dividend payments and $3 billion of common stock repurchases.
“We delivered strong top-line growth, profit margin expansion and cash productivity in the first quarter, enabling us to increase our outlook for fiscal year results,” said David Taylor, Chairman, President and Chief Executive Officer. “We will continue executing our strategies of superiority, productivity, constructive disruption and improving P&G’s organization and culture to deliver balanced top-line and bottom-line growth along with strong cash generation in a challenging competitive and macroeconomic environment.”
- Beauty segment organic sales increased ten percent versus year ago. Skin and Personal Care organic sales increased mid-teens driven by premium innovation, positive product mix, primarily from the disproportionate growth of the super-premium SK-II brand and China Olay, and increased pricing. Hair Care organic sales increased mid-single digits driven by innovation and devaluation-driven price increases.
- Grooming segment organic sales increased one percent versus year ago. Shave Care organic sales was unchanged as the benefit of devaluation-driven price increases were offset by related unit volume declines and competitive activity. Appliances organic sales increased low single digits as increased pricing and positive mix impact from the disproportionate growth of premium products were partially offset by volume decreases due to category contraction and retailer inventory reduction.
- Health Care segment organic sales increased nine percent. Oral Care organic sales increased high single digits due to volume growth and positive mix driven by premium toothpaste and toothbrush innovation and increased pricing. Personal Health Care organic sales increased double digits primarily due to innovation, higher retailer inventory build versus the base period for the cough and cold season, increased pricing and positive mix due to strong growth in North America which has higher than average selling prices. Personal Health Care all-in sales increased over 50% versus the base period due to the addition of the Merck OTC business.
- Fabric and Home Care segment organic sales increased eight percent for the quarter. Fabric Care organic sales increased high single digits driven by innovation and market growth. Home Care organic sales increased high single digits driven by innovation and devaluation related price increases.
- Baby, Feminine and Family Care segment organic sales increased five percent versus year ago. Baby Care organic sales increased low single digits due to innovation, devaluation related price increases and positive mix from premium innovation, partially offset by competitive activity and category contraction in some markets. Feminine Care organic sales increased high single digits driven by innovation, positive product mix due to the disproportionate growth of premium products and increased pricing. Family Care organic sales increased high single digits due to innovation and increased pricing.
Fiscal Year 2020 Guidance
The Company raised its outlook for fiscal 2020 all-in sales growth from a range of three to four percent to a range of three to five percent growth versus the prior fiscal year. This estimate includes a modest negative impact from foreign exchange, largely offset by a modest positive impact from acquisitions and divestitures. The Company increased its guidance for organic sales growth from a range of three to four percent to a range of three to five percent growth.
The Company increased its guidance range for fiscal 2020 all-in GAAP diluted net earnings per share growth to 225% to 243%, noting that the comparison period is significantly depressed by the Gillette Shave Care impairment adjustments in fiscal 2019. P&G raised its fiscal 2020 guidance for core earnings per share growth from a range of four to nine percent to a range of five to ten percent growth versus fiscal 2019.
The Company is not able to reconcile its forward-looking non-GAAP cash flow measure without unreasonable efforts because the Company cannot predict the timing and amounts of discrete cash items, such as acquisitions, divestitures, or impairments, which could significantly impact GAAP results. The Company increased its estimate for fiscal 2020 adjusted free cash flow productivity from 90% to 95%. The Company expects to pay over $7.5 billion in dividends and repurchase $6 billion to $8 billion of common shares in fiscal 2020.
Procter & Gamble (NYSE: PG) stock price history
The image below obtained from Google shows the stock price history of Procter & Gamble (NYSE: PG) for the last 5 years. 5 years ago the stock of Procter & Gamble was trading at around $85.20 and its currently trading at $123.55 a stock. That's a return of % provided to Procter & Gamble stockholders over the last 5 years.
The stock of Procter & Gamble is trading at a lot closer to its 52 week high of $125.36 than it is to its 52 week low of $85.23, which to us is a clear indication that the short term sentiment and momentum of Procter & Gamble's stock is positive.
The stock of Procter & Gamble is trading at a lot closer to its 52 week high of $125.36 than it is to its 52 week low of $85.23, which to us is a clear indication that the short term sentiment and momentum of Procter & Gamble's stock is positive.
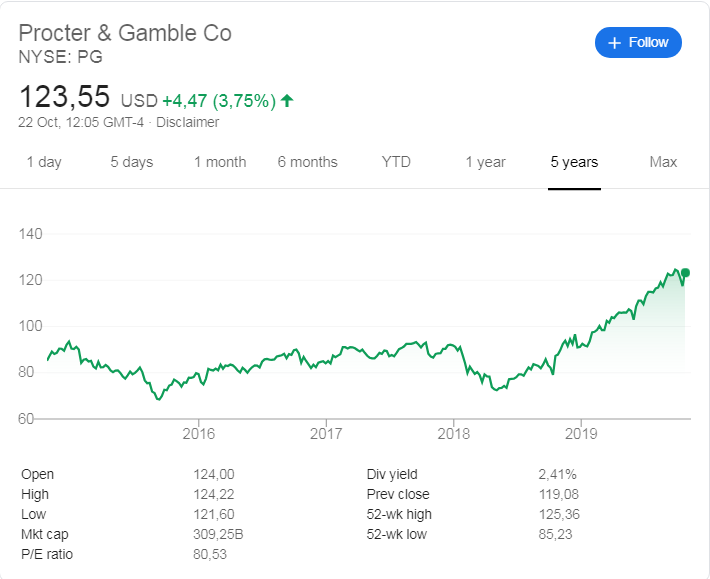
Procter & Gamble ( NYSE: PG) stock price history over the last 5 years
Recent coverage of Procter & Gamble
The extract regarding the latest earnings report from Procter & Gamble was obtained from TheStreet.com
Procter & Gamble (PG - Get Report) beat fiscal first-quarter earnings estimates Tuesday and raised its guidance for its fiscal 2020. This positive report should have caused the stock to set a new all-time high, but it did not. Tuesday's post-earnings high has been $124.22 vs. its all-time intraday high of $125.36 set on Sep. 30. My reason for concern is that the stock's weekly slow stochastic reading is falling out of overbought territory and a close on Friday below its five-week modified moving average at $120.89 would downgrade the weekly chart to negative. I show downside risk to its 200-day simple moving average at $108.90. The stock is also overvalued fundamentally with its P/E multiple of 25.93 and a dividend yield of 2.54%, respectively. P&G is a component of the Dow Jones Industrial Average and has been a solid performer so far in 2019. The stock closed Monday at $119.08, up 29.5% year to date and in bull market territory 37.3% above its Dec. 26 low of $86.74.
Read the full article here
Procter & Gamble (NYSE: PG) stock valuation
Based on Procter & Gamble's latest earnings report what do we value their stock at? Based on Procter & Gamble's earnings reported our valuation model provides a target (full value) price at $114.30 per Procter & Gamble stock. We therefore believe that the stock of Procter & Gamble is overvalued.
We usually recommend long term fundamental or value investors look to enter a stock at least 10% below our target (full value) price which in this case is $114.30. We therefore believe a good entry point into Procter & Gamble's stock is at $102.90or below. We expect the stock price of Procter & Gamble's to pull back slightly in coming weeks and months to levels closer to our target (full value) price of $114.30
We usually recommend long term fundamental or value investors look to enter a stock at least 10% below our target (full value) price which in this case is $114.30. We therefore believe a good entry point into Procter & Gamble's stock is at $102.90or below. We expect the stock price of Procter & Gamble's to pull back slightly in coming weeks and months to levels closer to our target (full value) price of $114.30
Next earnings release of Procter & Gamble
It is expected that Procter & Gamble will release their Q2, 2020 earnings report in late January 2020