|
Related Topics
|
|
Category: Stock Market and SpartanNash
Date: 15 September 2019 Stock Price: $11.89 We take a look at the 2nd quarter earnings release of their 2019 fiscal year of SpartanNash a grocery distribution company that also distributes groceries to US military bases.
|
|
About SpartanNash
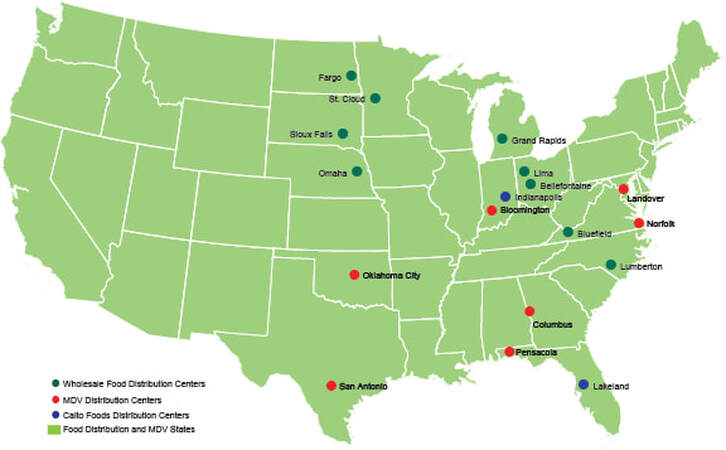
SpartanNash (Nasdaq: SPTN) is a Fortune 400 company whose core businesses include distributing grocery products to a diverse group of independent and chain retailers, its corporate-owned retail stores and U.S. military commissaries and exchanges; as well as premier fresh produce distribution and fresh food processing. SpartanNash serves customer locations in all 50 states and the District of Columbia, Europe, Cuba, Puerto Rico, Bahrain, Djibouti and Egypt. SpartanNash currently operates 160 supermarkets, primarily under the banners of Family Fare, Martin's Super Markets, D&W Fresh Market, VG's Grocery, Dan's Supermarket and Family Fresh Market. Through its MDV military division, SpartanNash is a leading distributor of grocery products to U.S. military commissaries.
The image below shows the locations of SpartanNash's various distribution centres
The image below shows the locations of SpartanNash's various distribution centres
Overview of SpartanNash's latest earnings report
The numbers we are interested in (for the quarter):
- Total revenue: $1.995 billion (up from $1.895 billion from the same quarter of the previous year)
- Revenues increased by 5.2% over the last 12 months
- Total operating expenses: $1.706 billion (down from $1.630 billion for the same quarter of the previous year)
- Cost of revenues increased by 4.67% over the last 12 months
- Net loss: $6.814 million (down from $17.7 million for the same quarter of the previous year)
- Diluted earnings per share: -$0.19 (down from $0.49 for the same quarter of the previous year)
- Diluted weighted-average shares outstanding: 36.326 million (up from 35.940 million for the same quarter of the previous year)
- Cash and cash equivalents: $19.949 million
- Cash and cash equivalents per share: $0.55
- Cash and cash equivalents makes up 4.6% of SpartanNash's market capital
- Cash and cash equivalents makes up 0.87% of SpartanNash's total assets
- Accounts receivable: $326.605 million
- Accounts receivable makes up 5.82% of the SpartanNash's total assets.
- Inventories: $572.723 million
- Inventories makes up 24.98% of SpartanNash's total assets
- Inventories makes up 24.98% of SpartanNash's total assets
- Stockholders equity for SpartanNash: $687.645 million
- Stockholders equity per share: $18.92
- SpartanNash is trading at 0.62 times its stockholders equity. It is odd to see firms trading at below their stockholders equity per share. Most firms tend to trade at levels 3 to 4 times their stated stockholders equity.
SpartanNash's management commentary on the results and earnings guidance
SpartanNash Company (the "Company") (Nasdaq: SPTN) today reported financial results for the 12-week second quarter and 28-week period ended July 13, 2019.
"Consistent with our comments in the press release issued earlier this week, the Board of Directors and I remain confident in the Company's overall strategic direction," said Dennis Eidson, Interim President and Chief Executive Officer. "I am excited to work with our team of talented associates as we focus our efforts on improved execution, while continuing to drive our top-line sales growth."
Food Distribution
Net sales for Food Distribution decreased $6.3 million, or 0.7%, to $935.4 million from $941.7 million in the prior year quarter. Excluding the impact of the elimination of intercompany sales to Martin's subsequent to the acquisition, sales increased 3.0%, primarily due to sales growth from existing customers. The Company's rate of sales growth within this segment decelerated from recent quarters, largely due to the unseasonably cool and wet weather during the months of May and June. These trends improved during the month of July as the weather returned to more seasonable levels.
Reported operating earnings for Food Distribution were $0.3 million compared to $18.7 million in the prior year quarter. The decrease in reported operating earnings was due to asset impairment charges primarily associated with changes to the Caito Fresh Production business noted above, losses associated with the Fresh Kitchen operations, and higher supply chain expenses, partially offset by lower recall charges than in the prior year, and favorable adjustments to incentive compensation. Second quarter adjusted operating earnings(1) were $16.8 million compared to $19.8 million in the prior year quarter primarily due to higher supply chain expenses. Adjusted operating earnings exclude $16.0 million of asset impairment charges and the allocation of one-time costs associated with Project One Team in the current year quarter, and merger/acquisition and integration expenses in the prior year quarter.
Military Distribution
Net sales for Military Distribution increased $0.9 million, or 0.2%, to $490.6 million from $489.7 million in the prior year quarter. The increase was primarily due to incremental volume from new business with an existing customer that commenced late in the fourth quarter of 2018 and DeCA's private brand program, partially offset by lower comparable sales at DeCA operated locations.
Reported operating loss for Military Distribution was $1.6 million compared to operating earnings of $3.1 million in the prior year quarter. The decrease was primarily attributable to lower margin rates, partly due to a shift in the mix of business, and higher supply chain costs, as well as the cycling of gains related to the sale of a closed facility in the prior year quarter, partially offset by favorable adjustments to incentive compensation. The second quarter adjusted operating loss(1) was $1.5 million compared to earnings of $2.3 million in the prior year quarter. The adjusted operating loss in the current year quarter excludes the allocation of one-time costs associated with Project One Team and the gain on the sale of a closed location in the prior year quarter.
Retail
Net sales for Retail increased $105.4 million, or 22.7%, to $570.0 million from $464.6 million in the prior year quarter. Excluding the acquisition of Martin's, sales decreased 3.3%, due to lower sales resulting from store closures and a decrease in comparable store sales of 2.0%. Comparable store sales were negatively impacted by the shift of the post-Easter week into the second quarter by 0.5%, as well as the unseasonably cool weather for the first two periods of the quarter.
Reported operating earnings for Retail were $8.7 million compared to operating earnings of $8.0 million in the prior year quarter. The increase in reported operating earnings was primarily attributable to the contribution of the acquired Martin's stores, the favorable impact of closing underperforming stores and favorable adjustments to incentive compensation, partially offset by higher fees paid to pharmacy benefit managers. Adjusted operating earnings(1) were $8.2 million compared to $7.7 million in the prior year quarter and exclude restructuring gains and merger/acquisition and integration expenses in the current year and restructuring gains in the prior year quarter.
Outlook
The Company continues to expect financial results for the fiscal year ending December 28, 2019 consistent with its outlook previously provided on August 12, 2019 The image below shows the fiscal guidance of SpartanNash for their ful 2019 fiscal year

The Company's fiscal year guidance reflects an effective tax rate of 22.0% to 23.0%, due to a shift in profitability into lower tax jurisdictions. The Company expects capital expenditures for fiscal year 2019 to be in the range of $86.0 million to $92.0 million, with depreciation and amortization of $89.0 million to $91.0 million. Interest expense is now expected to range from $34.0 million to $35.0 million in fiscal 2019.
The Company's updated guidance for fiscal 2019 does not include costs associated with the CEO transition and costs from a non-recurring, supplemental, transition incentive program for eligible associates.
The Company's updated guidance for fiscal 2019 does not include costs associated with the CEO transition and costs from a non-recurring, supplemental, transition incentive program for eligible associates.
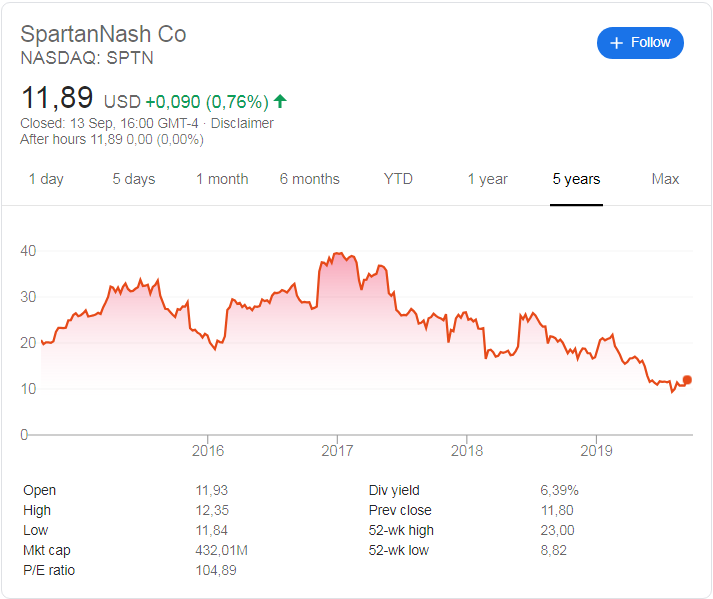
SpartanNash (NASDAQ: SPTN) stock price history
The image below, obtained from Google, shows the stock price history of SpartanNash (NASDAQ:SPTN) for the last 5 years. And its not been a good time for SpartanNash stockholders unfortunately. 5 years ago SpartanNash was trading at around $20.50 a stock and its currently trading at $11.89. Thats a negative return of -42% provided by SpartanNash over the last 5 years. SpartanNash is also trading at a lot closer to its 52 week low of $8.82 than it is to its 52 week high o $23 which is a clear indication that the sentiment and momentum towards SpartanNash is negative.
Recent coverage of SpartanNash
The extract below shows recent coverage of SpartanNash as obtained from Zacks
Spartan Stores (SPTN - Free Report) came out with quarterly earnings of $0.34 per share, in line with the Zacks Consensus Estimate. This compares to earnings of $0.50 per share a year ago. These figures are adjusted for non-recurring items. A quarter ago, it was expected that this grocery store operator and grocery distributor would post earnings of $0.23 per share when it actually produced earnings of $0.24, delivering a surprise of 4.35%.\
Over the last four quarters, the company has surpassed consensus EPS estimates just once. Spartan Stores, which belongs to the Zacks Food - Natural Foods Products industry, posted revenues of $2 billion for the quarter ended June 2019, missing the Zacks Consensus Estimate by 0.14%. This compares to year-ago revenues of $1.90 billion. The company has topped consensus revenue estimates just once over the last four quarters.
The sustainability of the stock's immediate price movement based on the recently-released numbers and future earnings expectations will mostly depend on management's commentary on the earnings call. Spartan Stores shares have lost about 45.2% since the beginning of the year versus the S&P 500's gain of 16.7%.
Read the full article here
SpartanNash (NASDAQ: SPTN) latest stock valuation
So based on SpartanNash's latest earnings report and their fiscal guidance provided what are SpartanNash stock worth? While it is hard to value loss making companies, there are a few variables than can be used to provide a valuation for the stock of SpartanNash. As a base one would say that the stockholders equity per share would be a good start, as that shows the value a company is worth if it sells all its assets, pay all its debts and liabilities and distributes the rest to South Africa. SpartanNash's stockholders equity per share is currently sitting at $18.92. And based on the earnings guidance provided for the full fiscal year we have a target (full value) price for SpartanNash of $21.00. We therefore believe that SpartanNash is undervalued at its current price and we expect the stock price of SpartanNash to tend upwards in coming weeks and months.