|
Related Topics
|
|
Category: Stitch Fix (SFIX) and Technical Analysis
Date: 16 July 2020 Stock Price of Stitch Fix : $98.21 The stock price of SFIX has increased by 76.3% since its listing in 2017. A decent return provided to stockholders. The question is what is next for Stitch Fix stock? Where is it heading over the short and longer term?
|
|
Over the 2 and a half year period the stock of Stitch Fix increased by a decent 76.3%. While no stockholder will say no to these types of returns, the question is where to from here for the stock of Stitch Fix stock price history since their listing Below we do some technical analysis on Stitch Fix stock price in order to determine the most likely route SFIX stock is to take in coming weeks and months."
More About Stitch Fix
Stitch Fix is the world’s leading online personal styling service. We combine data science and human judgment to deliver apparel, shoes, and accessories personalized to our clients’ unique tastes, lifestyles, and budgets. Our service is available for women, men, and kids, and designed to help all our clients look, feel, and be their best selves.
Since our founding in 2011, we have helped millions of men, women, and kids discover and buy what they love through personalized shipments of apparel, shoes, and accessories, hand-selected by Stitch Fix stylists and delivered to our clients’ homes. We call each of these shipments a Fix. Clients can choose to schedule automatic shipments or order a Fix on demand after they fill out a style profile on our website or mobile app. For each Fix, we charge clients a styling fee that is credited toward items they purchase. Alternatively, select U.S. clients may purchase an annual Style Pass, which offers unlimited styling for the year for a $49 fee that is also credited towards items they purchase. After receiving a Fix, our clients purchase the items they want to keep and return the other items, if any, at no additional charge. In addition, our Extras feature allows clients to select items such as socks, bras, underwear, and other intimates that are then added to the items their stylist selects for their Fix. Stitch Fix was founded with a focus on Women’s apparel. In our first few years, we were able to gain a deep understanding of our clients and merchandise and build the capability to listen to our clients, respond to feedback, and deliver the experience of personalization. More recently, we have extended those capabilities into Petite, Maternity, Men’s, Plus, and Kids apparel, as well as shoes and accessories.
Quick facts about Stitch Fi (SFIX)
- Stitch Fix is listed on the Nasdaq under the stock code ticker: SFIX
- 3.236 million active clients as at the end of August 2019
- Gross margin: 44.6%
- Net profit margin: 2.34%
- Revenues for their 2019 fiscal year: $1.577 billion
- Shares in issue for Stitch Fix: 103.653 million
- Earnings per share (EPS) for full fiscal 2019: $0.36
- Cash and cash equivalents at the end of 2019 fiscal year: $170.932 million
- Stockholders equity in Stitch Fix: $396 million

Stitch Fix
Stitch Fix (SFIX) stock price history since its listing
The image below shows the stock price history of Stitch Fix (SFIX) since its listing. And it's been decent time for Stitch Fix stockholders with the stock of Stitch Fix (SFIX) increasing by 76.3% since their listing
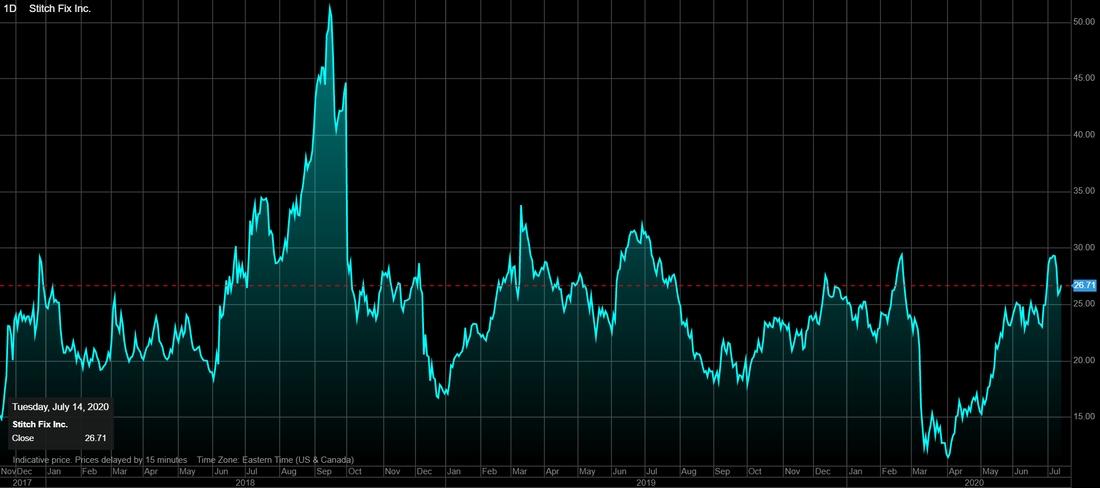
Stitch Fix (SFIX) stock price history since their listing
Over the 2 and a half year period the stock of Stitch Fix increased by a decent 76.3%. While no stockholder will say no to these types of returns, the question is where to from here for the stock of Stitch Fix stock price history since their listing Below we do some technical analysis on Stitch Fix stock price in order to determine the most likely route SFIX stock is to take in coming weeks and months.
Technical Analysis of JPMorgan Chase (JPM) stock price
While there are many different technical analysis indicators we tend to follow the principle of keeping things simple. The KIS principle. So we will take a look at the shorter term moving averages and the longer term moving averages as well as the Relative Strength Index (RSI). So let's focus at the longer term moving averages first.
Below we do some technical analysis on Stitch Fix (SFIX) stock price in order to determine the most likely route SFIX stock is to take in coming weeks and months. The image below shows the stock price of Stitch Fix (SFIX) as well as its 50 day and 200 day moving average as well as the RSI.
Below we do some technical analysis on Stitch Fix (SFIX) stock price in order to determine the most likely route SFIX stock is to take in coming weeks and months. The image below shows the stock price of Stitch Fix (SFIX) as well as its 50 day and 200 day moving average as well as the RSI.
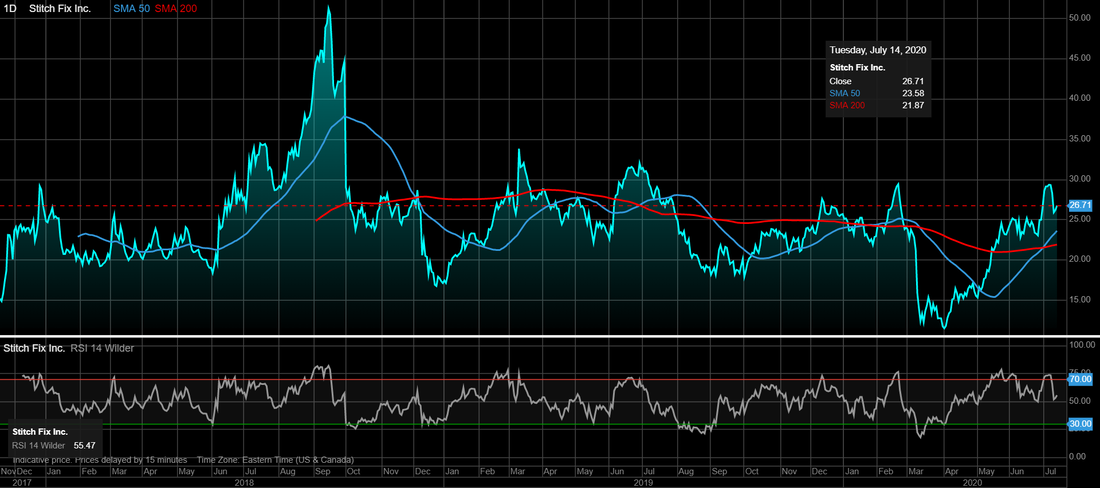
Stitch Fix (SFIX) stock price with its 50 and 200 day moving average and RSI
From the image above, one can see that the RSI is just above the midpoint of 50, but below the 70 mark, which is an indicator of a stock being overbought (basically it is due for a correction). So the RSI is not providing a definitive sign of where the stock is heading, but since it touched 70 relatively recently and has pulled back from there we believe the stock of Stitch Fix (SFIX) is in a correction phase right now which could signal further stock price weakness in coming weeks.
Turning our attention to the moving averages one can see the 50 day moving average crossed above the 200 day moving average (which is a positive sign for a company's stock price). If the 50 day moving average crosses below the 200 day moving average it is a negative sign and indicates potential stock declines, if the 50 day crosses above the 200 day moving average its a positive sign for a company's stock price.
From the image above one can see the 50 day moving average is above the 200 day moving average, which is a positive sign. But since the RSI has been coming down recently and its pointing to a potential further decline in the stock of Stitch Fix (SFIX) the question is how far will it fall, if it falls? The 50 day moving average and 200 day moving average also shows medium and long term support levels for a stock price. So should STZ stock decline more it is expected to find medium and longer term support at the following prices:
As we mentioned 50 day and 200 day moving averages are longer term technical indicators, so let's take a look at shorter term indicators. The image below shows the stock price of Stitch Fix as well as its 10 day and 30 day moving average as well as the RSI.
Turning our attention to the moving averages one can see the 50 day moving average crossed above the 200 day moving average (which is a positive sign for a company's stock price). If the 50 day moving average crosses below the 200 day moving average it is a negative sign and indicates potential stock declines, if the 50 day crosses above the 200 day moving average its a positive sign for a company's stock price.
From the image above one can see the 50 day moving average is above the 200 day moving average, which is a positive sign. But since the RSI has been coming down recently and its pointing to a potential further decline in the stock of Stitch Fix (SFIX) the question is how far will it fall, if it falls? The 50 day moving average and 200 day moving average also shows medium and long term support levels for a stock price. So should STZ stock decline more it is expected to find medium and longer term support at the following prices:
- 50 day moving average: $23.58
- 200 day moving average : $21.87
As we mentioned 50 day and 200 day moving averages are longer term technical indicators, so let's take a look at shorter term indicators. The image below shows the stock price of Stitch Fix as well as its 10 day and 30 day moving average as well as the RSI.
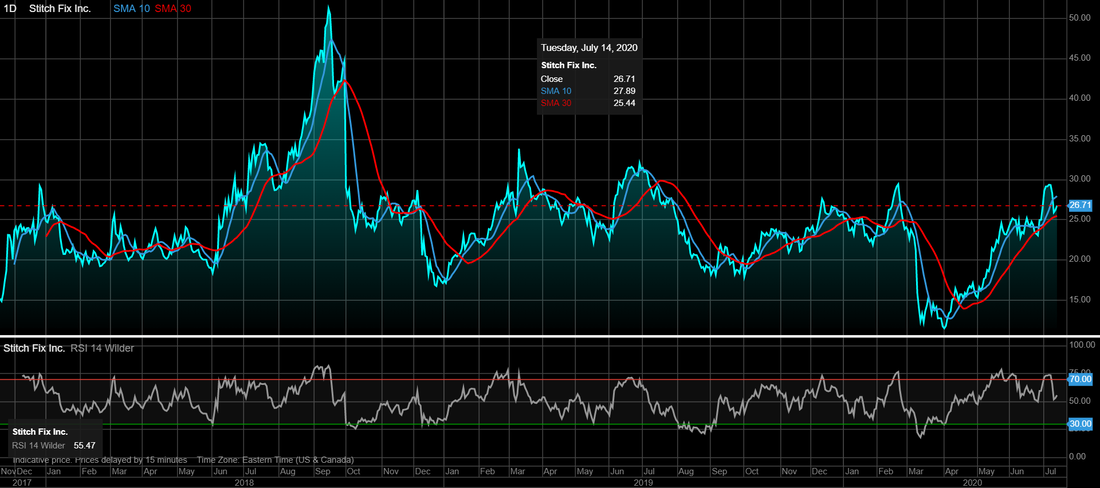
Stitch Fix (SFIX) stock price with its 10 and 30 day moving average and RSI
In a similar vein to the approach to the longer term analysis, if the 10 day moving averages crosses over above the 30 day moving average it is a positive sign for a stock and if the 10 day moving average crosses below the 30 day moving average its a negative sign for a stock price. At this point the 10 day moving average is trading at well above the 30 day moving average (a positive sign). But since the RSI is indicating potential further declines the question is over the shorter term period where are the support levels for Stitch Fix stock price?
So should Stitch Fix stock be in for a correction as the RSI indicates it has been in a correction phase for a while, the first support levels will be the shorter term levels shown above. If the stock falls below these support levels the next support levels will be the 50 day and 200 day moving average levels.
Thus if the stock of Stitch Fix (SFIX) decides today to start its decline we will see the following levels as support levels for Stitch Fix
While the short term and medium to longer term moving averages for Stitch Fix all point in a positive direction, the fact that the RSI was recently in overbought territory (above 70) and is now far from this level, we do believe the stock is due some weakness until the RSI hits the levels around 30 which would indicate oversold territory and indicate an end to the correction and point to an upward cycle. For now if the stock of SFIX declines strongly and falls through the 30 day moving average the next level it would head to is the 50 day moving average and if it falls below that price the stock of SFIX could head all the way down to its 200 day moving average which is currently at $21.87
- 10 day moving average: $27.89
- 30 day moving average: $25.44
So should Stitch Fix stock be in for a correction as the RSI indicates it has been in a correction phase for a while, the first support levels will be the shorter term levels shown above. If the stock falls below these support levels the next support levels will be the 50 day and 200 day moving average levels.
Thus if the stock of Stitch Fix (SFIX) decides today to start its decline we will see the following levels as support levels for Stitch Fix
- 10 day moving average: $27.89
- 30 day moving average: $25.44
- 50 day moving average: $23.58
- 200 day moving average : $21.87
While the short term and medium to longer term moving averages for Stitch Fix all point in a positive direction, the fact that the RSI was recently in overbought territory (above 70) and is now far from this level, we do believe the stock is due some weakness until the RSI hits the levels around 30 which would indicate oversold territory and indicate an end to the correction and point to an upward cycle. For now if the stock of SFIX declines strongly and falls through the 30 day moving average the next level it would head to is the 50 day moving average and if it falls below that price the stock of SFIX could head all the way down to its 200 day moving average which is currently at $21.87