Stock price performance comparison: Cracker Barrel (CBRL) vs Darden Restaurants (DRI)
|
Category: Cracker Barrel (CBRL) and Darden Restaurants (DRI)
Date: 26 September 2021 Stock price of Cracker Barrel (CBRL): $144.94 Stock price of Darden Restaurants (DRI) : $158.70 Our latest stock price performance comparison between two dine in restaurant brands. We take a look at the stock price performance of Cracker Barrel Old Country Stores (CBRL) and compare it to Darden Restaurants whose brands include Olive Garden and Longhorn Steakhouses. Which of these two firms stocks have served up the best returns over the last 5 years?
|
|
Our YouTube channel is now live. Watch short summary videos of our articles
The stock of Darden Restaurants has easily outperformed that of Cracker Barrel over the last 5 years. Over the last 5 years for every 1% that Darden Restaurants increased the stock of Cracker Barrel increased by 0.06%"
More About Cracker Barrel Old Country Stores
Cracker Barrel Old Country Store, Inc. (Nasdaq: CBRL), established in 1969 in Lebanon, Tenn., provides a friendly home-away-from-home in its old country stores and restaurants. Guests are cared for like family while relaxing and enjoying real home-style food and shopping that’s surprisingly unique, genuinely fun and reminiscent of America’s country heritage…all at a fair price. The restaurants serve up delicious, home-style country food such as meatloaf and homemade chicken n’ dumplins as well as our signature biscuits using an old family recipe. The authentic old country retail store is fun to shop and offers unique gifts and self-indulgences
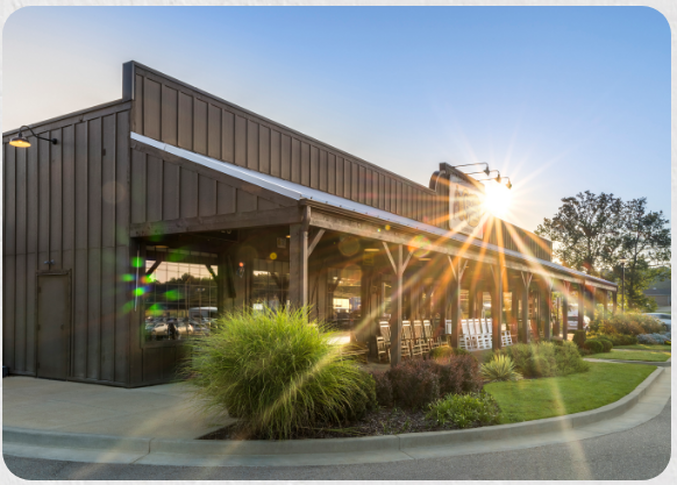
Cracker Barrel Old Country Store
More About Darden Restaurants (DRI)
|
Darden Restaurants, Inc. is a full-service restaurant company, and as of May 31, 2020, we owned and operated 1,804 restaurants through subsidiaries in the United States and Canada under the Olive Garden® , LongHorn Steakhouse® , Cheddar’s Scratch Kitchen® , Yard House® , The Capital Grille® , Seasons 52® , Bahama Breeze® and Eddie V’s Prime Seafood® trademarks.
We served over 355 million meals in fiscal 2020. As of May 31, 2020, we also had 62 restaurants operated by independent third parties pursuant to area development and franchise agreements |
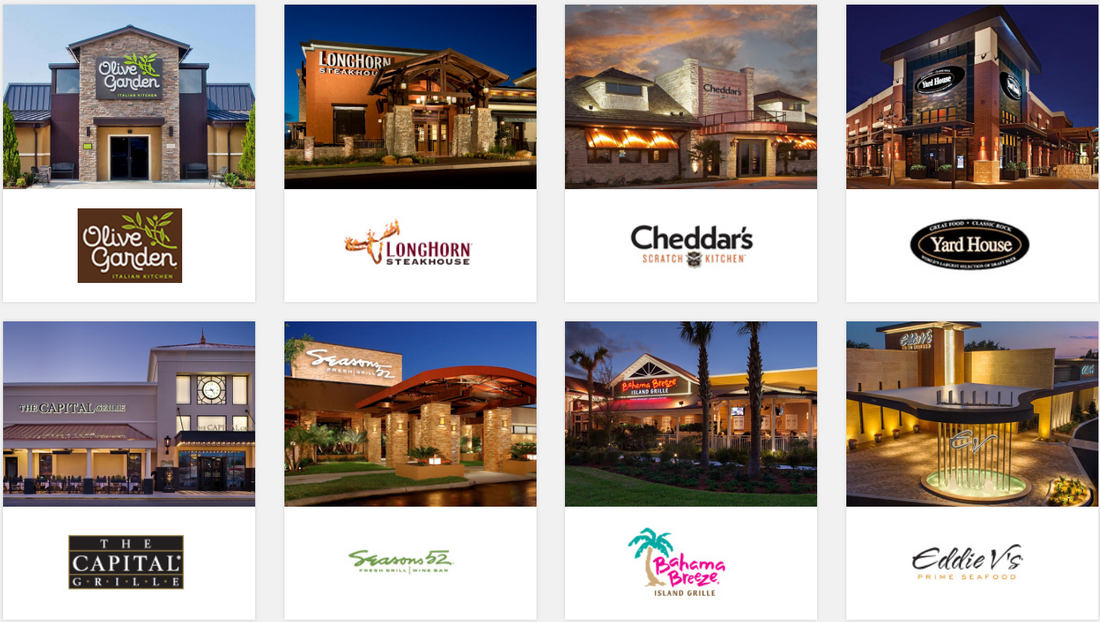
Darden Restaurant Brands
|
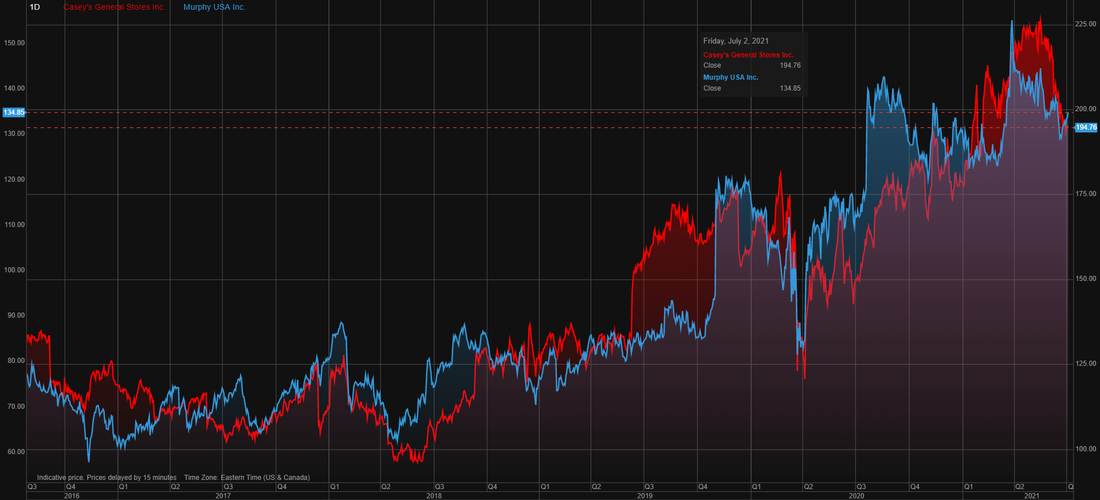
Cracker Barrel (CBRL) and Darden Restaurants (DRI) stock comparison chart
The image below shows the stock price performance of Cracker Barrel (CBRL) and Darden Restaurants (DRI) over the last 5 years. Both these firms stocks are active in the full service and dine in restaurant space, but their stock price returns are very different. The summary below shows the stock price returns of Cracker Barrel (CBRL) and Darden Restaurants (DRI) over the last 5 years:
The stock of Darden Restaurants has easily outperformed that of Cracker Barrel over the last 5 years. Over the last 5 years for every 1% that Darden Restaurants increased the stock of Cracker Barrel increased by 0.06%
- Darden Restaurants (DRI): 154.2%
- Cracker Barrel (CBRL): 9.7%
The stock of Darden Restaurants has easily outperformed that of Cracker Barrel over the last 5 years. Over the last 5 years for every 1% that Darden Restaurants increased the stock of Cracker Barrel increased by 0.06%
Cracker Barrel (CBRL) and Darden Restaurants (DRI) stock comparison chart
Market Capital of Cracker Barrel (CBRL) and Darden Restaurants (DRI)
So what does market capital mean? Well it basically shows what a firm is worth based on the number of shares it has in issue and its current stock price. As at 26 September 2021 Cracker Barrel (CBRL) and Darden Restaurant (DRI) has the following market capitals
Based on the current market capital of both firms Darden (DRI) is 6.05 times the size of Cracker Barrel CBRL). Put differently Darden is worth 508% more than Cracker Barrel
- Market Capital of Cracker Barrel (CBRL): $3.4 billion
- Market Capital of Darden Restaurants (DRI): $20.7 billion
Based on the current market capital of both firms Darden (DRI) is 6.05 times the size of Cracker Barrel CBRL). Put differently Darden is worth 508% more than Cracker Barrel