
|
Related Topics
|
|
Category: The Home Depot (HD) and Technical Analysis
Date: 16 July 2020 Stock Price of The Home Depot : $257.80 The stock price of The Home Depot (HD) has increased by 88.52% over the last 5 years. A decent return provided to stockholders. The question is what is next for the stock of The Home Depot? Where is it heading over the short and longer term?
|
|
Over the last 5 years the stock of The Home Depot (HD) increased by 88.52%. While no stockholder will say no to these types of returns, the question is where to from here for the stock of The Home Depot (HD). Below we do some technical analysis on The Home Depot (HD) stock price in order to determine the most likely route HD stock is to take in coming weeks and months."
More About The Home Depot (HD)
The Home Depot, Inc. is the world’s largest home improvement retailer based on net sales for fiscal 2019. We offer our customers a wide assortment of building materials, home improvement products, lawn and garden products, and décor products and provide a number of services, including home improvement installation services and tool and equipment rental. As of the end of fiscal 2019, we had 2,291 The Home Depot stores located throughout the U.S. (including the Commonwealth of Puerto Rico and the territories of the U.S. Virgin Islands and Guam), Canada, and Mexico. The Home Depot stores average approximately 104,000 square feet of enclosed space, with approximately 24,000 additional square feet of outside garden area. We also maintain a network of distribution and fulfillment centers, as well as a number of e-commerce websites
The Home Depot is listed on the New York Stock Exchange under stock code ticker: HD
The data below refers to the full fiscal 2019:
The Home Depot is listed on the New York Stock Exchange under stock code ticker: HD
- Total revenues for 2019 fiscal year : $110.225 billion
- Number of Home Depot Stores: 2 291
- Average Home Depot store size: 104 000 square feet plus an average of 24 000 square feet for the outdoor and garden section
The data below refers to the full fiscal 2019:
- Comparable sales increase: 3.5%
- Comparable customer transactions increase: 1.1%
- Comparable average ticket increase:2.5%
- Customer transactions (in millions): 1,616.0
- Average ticket: $ 67.30
- Sales per retail square foot: $454.82
- Diluted earnings per share $ 10.25

The Home Depot
The Home Depot (HD) stock price history over the last 5 years
The image below shows the stock price history of The Home Depot (HD) over the last 5 years. And it's been decent time for The Home Depot (HD) stockholders with the stock of The Home Depot (HD) increasing by 88.52% over the last 5 years.
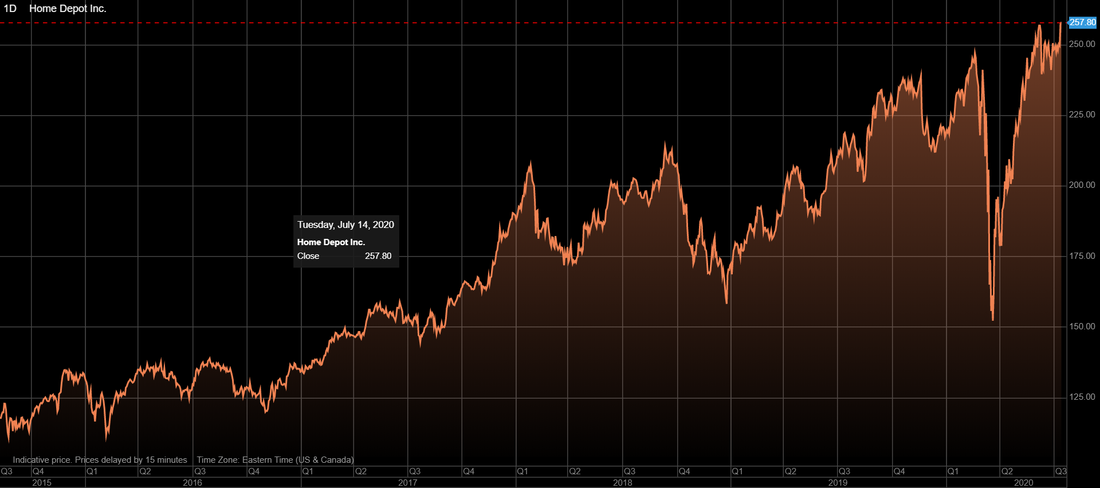
The Home Depot (HD) stock price history over the last 5 years
Over the last 5 years the stock of The Home Depot (HD) increased by 88.52%. While no stockholder will say no to these types of returns, the question is where to from here for the stock of The Home Depot (HD). Below we do some technical analysis on The Home Depot (HD) stock price in order to determine the most likely route HD stock is to take in coming weeks and months.
Technical Analysis of The Home Depot (HD) stock price
While there are many different technical analysis indicators we tend to follow the principle of keeping things simple. The KIS principle. So we will take a look at the shorter term moving averages and the longer term moving averages as well as the Relative Strength Index (RSI). So let's focus at the longer term moving averages first.
Below we do some technical analysis on The Home Depot (HD) stock price in order to determine the most likely route HD stock is to take in coming weeks and months. The image below shows the stock price of The Home Depot (HD) as well as its 50 day and 200 day moving average as well as the RSI.
Below we do some technical analysis on The Home Depot (HD) stock price in order to determine the most likely route HD stock is to take in coming weeks and months. The image below shows the stock price of The Home Depot (HD) as well as its 50 day and 200 day moving average as well as the RSI.

The Home Depot (HD) stock price with its 50 and 200 day moving average and RSI
From the image above, one can see that the RSI is just above the midpoint of 50, but below the 70 mark, which is an indicator of a stock being overbought (basically it is due for a correction). So the RSI is not providing a definitive sign of where the stock is heading, but since it touched 70 relatively recently and has pulled back from there we believe the stock of The Home Depot (HD) is in a correction phase right now which could signal further stock price weakness in coming weeks.
Turning our attention to the moving averages one can see the 50 day moving average crossed above the 200 day moving average (which is a positive sign for a company's stock price). If the 50 day moving average crosses below the 200 day moving average it is a negative sign and indicates potential stock declines, if the 50 day crosses above the 200 day moving average its a positive sign for a company's stock price.
From the image above one can see the 50 day moving average is well above the 200 day moving average, which is a positive sign. But since the RSI has been coming down recently from the 70 mark and is close to it again to us its pointing to a potential decline in the stock of The Home Depot (HD). The question is how far will it fall, if it falls? The 50 day moving average and 200 day moving average also shows medium and long term support levels for a stock price. So should HD stock decline more it is expected to find medium and longer term support at the following prices:
As we mentioned 50 day and 200 day moving averages are longer term technical indicators, so let's take a look at shorter term indicators. The image below shows the stock price of The Home Depot (HD) as well as its 10 day and 30 day moving average as well as the RSI.
Turning our attention to the moving averages one can see the 50 day moving average crossed above the 200 day moving average (which is a positive sign for a company's stock price). If the 50 day moving average crosses below the 200 day moving average it is a negative sign and indicates potential stock declines, if the 50 day crosses above the 200 day moving average its a positive sign for a company's stock price.
From the image above one can see the 50 day moving average is well above the 200 day moving average, which is a positive sign. But since the RSI has been coming down recently from the 70 mark and is close to it again to us its pointing to a potential decline in the stock of The Home Depot (HD). The question is how far will it fall, if it falls? The 50 day moving average and 200 day moving average also shows medium and long term support levels for a stock price. So should HD stock decline more it is expected to find medium and longer term support at the following prices:
- 50 day moving average: $245.04
- 200 day moving average : $226.32
As we mentioned 50 day and 200 day moving averages are longer term technical indicators, so let's take a look at shorter term indicators. The image below shows the stock price of The Home Depot (HD) as well as its 10 day and 30 day moving average as well as the RSI.
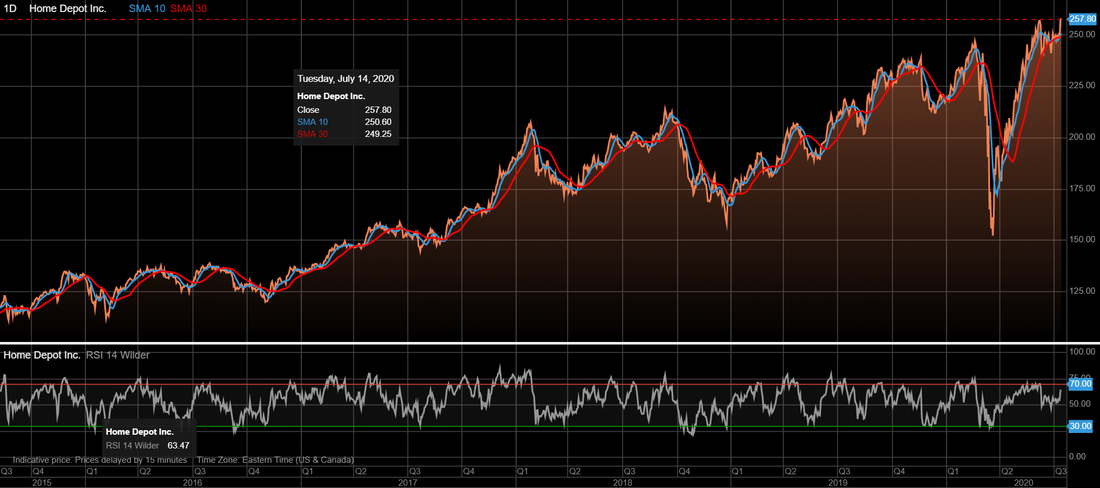
The Home Depot (HD) stock price with its 10 and 30 day moving average and RSI
In a similar vein to the approach to the longer term analysis, if the 10 day moving averages crosses over above the 30 day moving average it is a positive sign for a stock and if the 10 day moving average crosses below the 30 day moving average its a negative sign for a stock price. At this point the 10 day moving average is trading at very close to the 30 day moving average (a positive sign as it recently broke above the 30 day moving average). But since the RSI is indicating potential future declines the question is over the shorter term period where are the support levels for The Home Depot (HD) stock price?
So should The Home Depot (HD) stock be in for a correction the first support levels will be the shorter term levels shown above. If the stock falls below these support levels the next support levels will be the 50 day and 200 day moving average levels.
Thus if the stock of The Home Depot (HD) decides today to start its decline we will see the following levels as support levels for The Home Depot:
While the short term and medium to longer term moving averages for The Home Depot (HD) all point in a positive direction, the fact that the RSI was recently in overbought territory (above 70) and is approaching this level again, which indicates that HD is potentially overbought and due a correction.
We do believe the stock is due some weakness until the RSI hits the levels around 30 which would indicate oversold territory and indicate an end to the correction. So for now if the stock of HD declines strongly and falls through the 10 and 30 day moving average the next level it would head to is the 50 day moving average and if it falls below that price the stock of The Home Depot could head all the way down to its 200 day moving average which is currently at $226.32
- 10 day moving average: $250.60
- 30 day moving average: $249.25
So should The Home Depot (HD) stock be in for a correction the first support levels will be the shorter term levels shown above. If the stock falls below these support levels the next support levels will be the 50 day and 200 day moving average levels.
Thus if the stock of The Home Depot (HD) decides today to start its decline we will see the following levels as support levels for The Home Depot:
- 10 day moving average: $250.60
- 30 day moving average: $249.25
- 50 day moving average: $245.04
- 200 day moving average : $226.32
While the short term and medium to longer term moving averages for The Home Depot (HD) all point in a positive direction, the fact that the RSI was recently in overbought territory (above 70) and is approaching this level again, which indicates that HD is potentially overbought and due a correction.
We do believe the stock is due some weakness until the RSI hits the levels around 30 which would indicate oversold territory and indicate an end to the correction. So for now if the stock of HD declines strongly and falls through the 10 and 30 day moving average the next level it would head to is the 50 day moving average and if it falls below that price the stock of The Home Depot could head all the way down to its 200 day moving average which is currently at $226.32