
Tilly's (TLYS) earnings report review for the 2nd quarter of their 2021 fiscal year
|
Category: Tilly's (TLYS)
Date: 5 September 2021 Stock Price of Tilly's (TLYS): $14.78 Market Capital of Tilly's: $445 million We take a look at the 2nd quarter earnings report of their 2021 fiscal year of Tilly's (TLYS) a leading, destination specialty retailer of casual apparel, footwear and accessories for young men, young women, boys and girls with an extensive selection of iconic global. For the quarter the group reported $202 million and net income of $20.4 million.
|
|
Fiscal 2021 is off to a record-setting start with our best first quarter net sales and best earnings per share of any quarter since becoming a public company in May 2012 - Ed Thomas, President and Chief Executive Officer"
About Tilly's
Tillys is a leading, destination specialty retailer of casual apparel, footwear and accessories for young men, young women, boys and girls with an extensive selection of iconic global, emerging, and proprietary brands rooted in an active, outdoor and social lifestyle. Tillys is headquartered in Irvine, California and currently operates 244 total stores across 33 states

Teenagers wearing Tilly's
Overview of Tilly's 2nd quarter 2021 earnings report
Fiscal 2021 Second Quarter Operating Results Overview
The following comparisons refer to the Company's operating results for the second quarter of fiscal 2021 versus the second quarter of fiscal 2020 ended August 1, 2020:
The following comparisons refer to the Company's operating results for the second quarter of fiscal 2021 versus the second quarter of fiscal 2020 ended August 1, 2020:
- Total net sales were $202.0 million, a record for any quarter in the Company's history, and an increase of $66.1 million or 48.7%, compared to $135.8 million last year.
- Net sales from physical stores were $164.6 million, an increase of $80.8 million or 96.3%, compared to $83.9 million last year, primarily due to a strong product offering and the impact of the various periods of government-mandated store closures during last year's second quarter which resulted in only 65% of total store operating days being available during that period last year. Net sales from stores represented 81.5% of total net sales compared to 61.7% of total net sales last year. The Company ended the second quarter with 244 total stores compared to 238 total stores at the end of the second quarter last year (33 of which were closed to the public at that time). During the second quarter of fiscal 2021, the Company opened six new stores.
- Net sales from e-commerce were $37.3 million, a decrease of $(14.7) million or (28.2)%, compared to $52.0 million last year, primarily due to the anniversary of last year's triple-digit e-commerce net sales growth during May and June during the period of significant government-mandated store closures. E-commerce net sales represented 18.5% of total net sales compared to 38.3% of total net sales last year.
- Total comparable net sales for the second quarter of fiscal 2021 compared to the second quarter of fiscal 2019 increased by 18.3%. Comparable net sales from physical stores increased by 11.0%, with increases across all geographic markets, and e-commerce net sales increased by 63.4%. In the second quarter of fiscal 2019, total net sales from physical stores represented 85.9% of total net sales while net sales from e-commerce represented 14.1% of total net sales.
- Gross profit was $74.7 million, or 37.0% of net sales, compared to $41.7 million, or 30.7% of net sales, last year. Buying, distribution and occupancy costs improved by 800 basis points collectively, despite increasing by $1.7 million in total, due to leveraging these costs against higher net sales. Product margins decreased 170 basis points as a percentage of net sales due to the anniversary of last year's strong full-price selling upon the initial reopening of stores relative to certain inventory valuation reserves taken on idle store inventory at the end of the first quarter last year when all stores were closed. Compared to fiscal 2019’s second quarter, product margins improved by 190 basis points primarily due to reduced markdowns.
- Selling, general and administrative expenses ("SG&A") were $48.3 million, or 23.9% of net sales, compared to $34.0 million, or 25.0% of net sales, last year. SG&A improved by 110 basis points as a percentage of net sales, despite increasing by $14.3 million, due to leveraging these costs over higher net sales compared to last year. Primary causes of the SG&A dollar increase included store payroll and related benefits of $10.2 million, primarily due to operating all stores for the entirety of the quarter and serving significantly higher net sales, and corporate bonus accruals of $2.7 million associated with strong operating performance thus far in fiscal 2021.
- Operating income increased to $26.4 million, or 13.1% of net sales, compared to $7.7 million, or 5.7% of net sales, primarily due to the significant increase in net sales.
- Income tax expense was $5.9 million, or 22.5% of pre-tax income, compared to $2.8 million, or 34.3% of pre-tax income, last year. The decrease in the effective income tax rate was primarily due to deferred income tax benefits of $0.9 million derived from employee stock option exercise activity this year and the prior year impact of the Coronavirus Aid, Relief, and Economic Security Act (the "CARES Act"), which provided for net operating losses in fiscal 2020 to be carried back to earlier tax years with higher tax rates.
- Net income improved to $20.4 million, or $0.66 per diluted share, which are records for any quarter since the Company became publicly-traded in 2012, compared to $5.3 million, or $0.18 per diluted share, last year. Weighted average shares were 31.1 million this year compared to 29.7 million last year.
Tilly's management commentary on their 2nd quarter 2021 earnings
IRVINE, Calif.--(BUSINESS WIRE)--Sep. 2, 2021-- Tilly’s, Inc. (NYSE: TLYS, the "Company") today announced record-setting financial results for the second quarter and first half of fiscal 2021 ended July 31, 2021.
"Fiscal 2021 has been a record-setting year for us so far. Our second quarter results included a record level of net sales and earnings per share for any quarter, and our first half earnings per share exceeded the results of any full fiscal year, since we became a public company in 2012," commented Ed Thomas, President and Chief Executive Officer. "The back-to-school season is off to a strong start with double-digit percentage increases in comparable net sales in both physical stores and e-commerce compared to both last year and 2019. Despite ongoing concerns about the current resurgence of COVID-19 cases across the country, supply chain disruptions, labor challenges, and increasing costs generally, we remain cautiously optimistic about our business prospects for the second half of fiscal 2021."
Balance Sheet and Liquidity
As of July 31, 2021, the Company had $148.5 million of cash and marketable securities and no debt outstanding. This compared to $148.9 million at the end of the second quarter last year, which included an aggregate of $37.6 million of borrowed cash and withheld store lease payments. On July 9, 2021, the Company paid aggregate special cash dividends of $30.7 million, or $1.00 per share, to all Class A and Class B common stockholders of record as of June 25, 2021. The Company ended the second quarter with inventories per square foot up 25.6% relative to the end of the second quarter of fiscal 2020 and up 14.3% relative to the end of the second quarter of fiscal 2019 as the Company seeks to support the current momentum of its business. Total capital expenditures for the second quarter were $8.5 million compared to $4.3 million last year, the increase being primarily due to a higher number of new store openings this year.
Fiscal 2021 Third Quarter Business Update and Outlook
Total comparable net sales for fiscal August ended August 28, 2021, increased by 20.4% relative to the comparable period of fiscal 2019 with comparable increases from physical stores of 11.6% and from e-commerce of 81.0%. Based on current and historical trends, and assuming that all of the Company's stores and e-commerce will remain in operation throughout the third quarter, the Company would expect its third quarter net sales to be in the range of approximately $187 million to $193 million and earnings per diluted share to be in the range of $0.30 to $0.34. This outlook range is based on an assumed effective income tax rate of 27% and approximately 31.2 million weighted average diluted shares. The Company expects to have 243 total stores open at the end of the third quarter compared to 238 at the end of last year’s third quarter and 232 at the end of fiscal 2019’s third quarter.
Tilly's (TLYS) stock price chart over the last 5 years
The image below shows the stock price history of Tilly's over the last 5 years. And its been a decent time for Tilly investors. Over the last 5 years the stock has increased by a healthy 66.4%
The stock of Tilly's is trading at close to its 52 week high which is a clear indication that the short term sentiment and momentum of Tilly's stock is very positive at this point in time.
The stock of Tilly's is trading at close to its 52 week high which is a clear indication that the short term sentiment and momentum of Tilly's stock is very positive at this point in time.

Shake Shack (SHAK) stock price chart
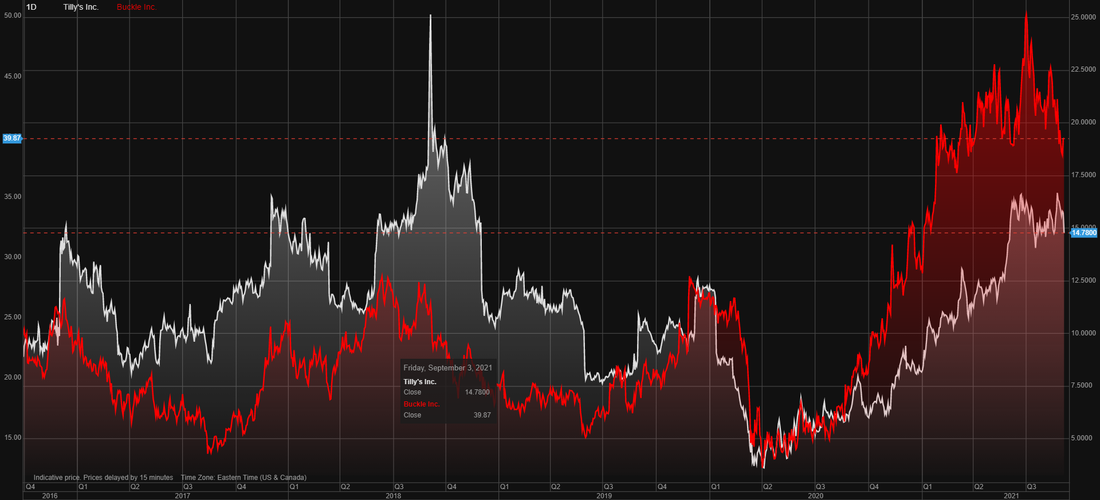
Tilly's (TLYS) vs Buckle (BKE) stock comparison over the last 5 years
The image below shows the stock price history of Tilly's and Buckle over the last 5 years. Both these firms are active in the on trend apparel sector. The overall returns provided by these two firms stocks are very similar. The summary below shows the stock price performance of these two firms over the last 5 years.
- Buckle (BKE): 68.4%
- Tilly's (TLYS): 66.4%
Tilly's (TLYS) vs Buckle (BKE) stock comparison over the last 5 years
Tilly's (TLYS) stock valuation
So based on Tilly's (TLYS) 2nd quarter 2021 earnings report what do we value the stock of Tilly's at? Based on Tilly's latest earnings report our valuation models provides a target price of $28.70 a stock.
We therefore believe the stock of Tilly's is undervalued at its current price. We usually recommend that investors look to enter a stock at least 10% below our target price. Thus a good entry point into the stock of Tilly's would be at $25.90
Since the stock of Tilly's is trading at well below our suggested entry point and target price, we rate the stock of Tilly's as a buy
Next earnings release of Tilly's
It is expected that Tilly's will release their 3rd quarter 2021 earnings report in late November 2021
Related Topics