
|
Related Topics
|
|
Category: International Trade, Import and Exports
Last updated: 21 May 2020 We cover the international trade of the United States in more detail. We take a look at the monthly value of goods and services imported into US and exported out of the US
The declines in March exports and imports were, in part, due to the impact of COVID-19, as many businesses were operating at limited capacity or ceased operations completely, and the movement of travelers across borders was restricted. " |

|
21 May 2020: U.S terms of trade with Canada up 22% over the last 12 months to April 2020
The extract below obtained from the BLS takes a look at the trade balance of the U.S with the rest of the world and focus on the trade balance that showed a 22% increase.
Terms of trade measure the change in the purchasing power of U.S. exports compared with imports. From April 2019 to April 2020, the U.S. terms of trade with Canada rose 22.0 percent, due to a 6.7-percent drop in export prices to Canada and a 23.5-percent drop in import prices from Canada. Over the same period, the U.S. terms of trade with industrialized countries rose 2.7 percent. Terms of trade with Pacific Rim countries fell 5.8 percent from April 2019 to April 2020.
Terms of trade measure the change in the purchasing power of U.S. exports compared with imports. From April 2019 to April 2020, the U.S. terms of trade with Canada rose 22.0 percent, due to a 6.7-percent drop in export prices to Canada and a 23.5-percent drop in import prices from Canada. Over the same period, the U.S. terms of trade with industrialized countries rose 2.7 percent. Terms of trade with Pacific Rim countries fell 5.8 percent from April 2019 to April 2020.
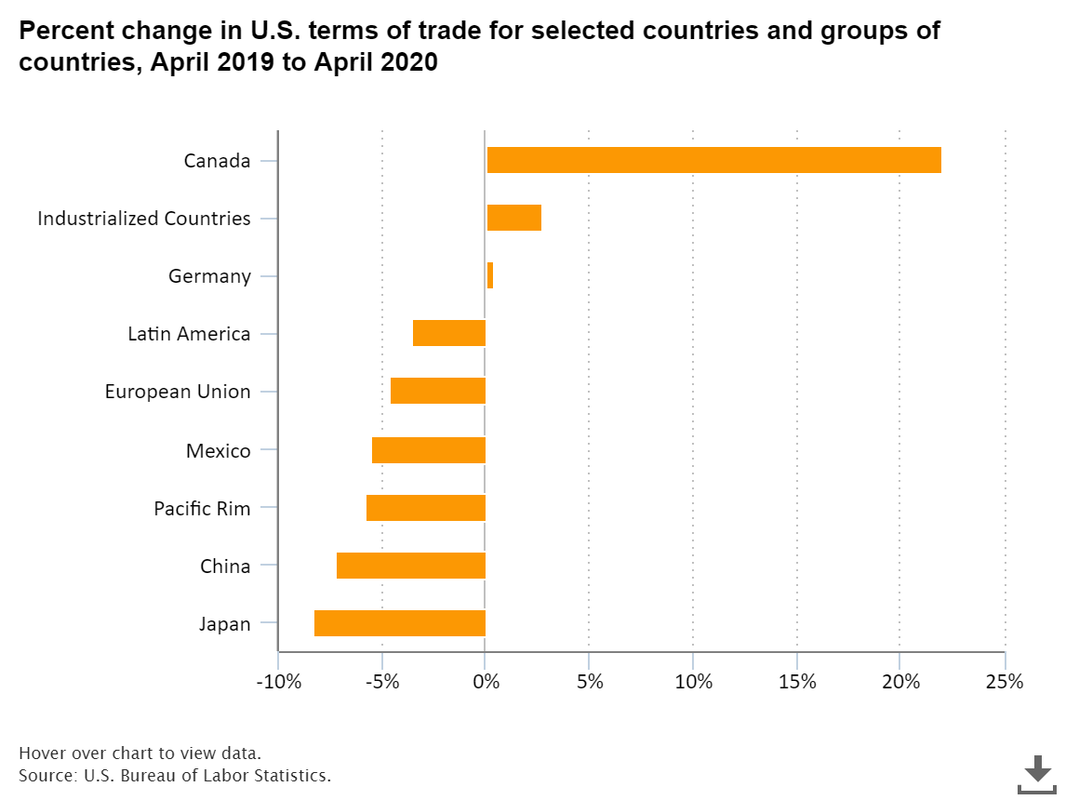
U.S terms of trade with Canada and other selected countries/regions
Among Pacific Rim countries, U.S. terms of trade with Japan fell 8.3 percent over the year. The U.S. terms of trade fell because export prices to Japan dropped 8.5 percent, while import prices from Japan declined by 0.1 percent.
13 May 2020: Imports, exports and trade balance for March 2020
The data below for the imports, exports and the trade balance of the USA for March 2020 was obtained from the Bureau of Economic Analysis. Below a short summary of the trade numbers for March 2020.
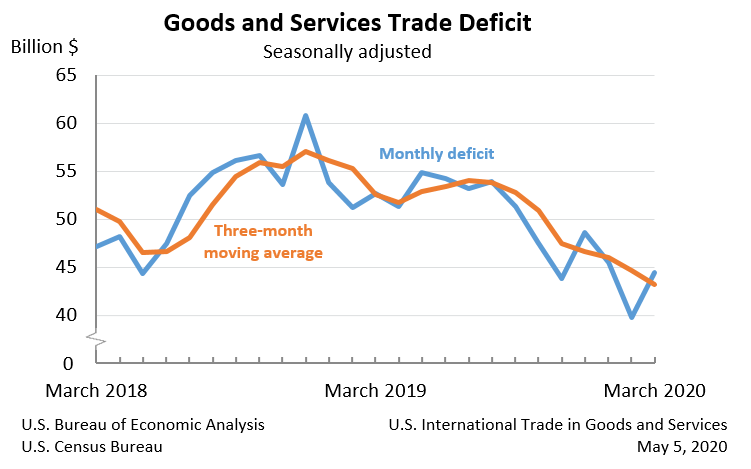
March exports were $187.7 billion, $20.0 billion less than February exports. March imports were $232.2 billion, $15.4 billion less than February imports. The March increase in the goods and services deficit reflected an increase in the goods deficit of $4.6 billion to $65.6 billion and a decrease in the services surplus of $0.1 billion to $21.2 billion. Year-to-date, the goods and services deficit decreased $28.1 billion, or 17.8 percent, from the same period in 2019. Exports decreased $21.7 billion or 3.5 percent. Imports decreased $49.7 billion or 6.4 percent.
March exports were $187.7 billion, $20.0 billion less than February exports. March imports were $232.2 billion, $15.4 billion less than February imports. The March increase in the goods and services deficit reflected an increase in the goods deficit of $4.6 billion to $65.6 billion and a decrease in the services surplus of $0.1 billion to $21.2 billion. Year-to-date, the goods and services deficit decreased $28.1 billion, or 17.8 percent, from the same period in 2019. Exports decreased $21.7 billion or 3.5 percent. Imports decreased $49.7 billion or 6.4 percent.
Exports:
Exports of goods decreased $9.2 billion to $128.1 billion in March.
Exports of goods on a Census basis decreased $8.8 billion.
Exports of services decreased $10.8 billion to $59.6 billion in March.
Imports:
Imports of goods decreased $4.7 billion to $193.7 billion in March.
Imports of goods on a Census basis decreased $4.2 billion.
Imports of services decreased $10.7 billion to $38.5 billion in March.
The declines in March exports and imports were, in part, due to the impact of COVID-19, as many businesses were operating at limited capacity or ceased operations completely, and the movement of travelers across borders was restricted. The full economic effects of the COVID-19 pandemic cannot be quantified in the trade statistics for March because the impacts are generally embedded in source data and cannot be separately identified
Exports of goods decreased $9.2 billion to $128.1 billion in March.
Exports of goods on a Census basis decreased $8.8 billion.
- Industrial supplies and materials decreased $2.9 billion.
- Crude oil decreased $1.0 billion.
- Other petroleum products decreased $0.9 billion.
- Fuel oil decreased $0.4 billion.
- Automotive vehicles, parts, and engines decreased $2.5 billion.
- Automotive parts and accessories decreased $0.9 billion.
- Passenger cars decreased $0.8 billion.
- Trucks, buses, and special purpose vehicles decreased $0.4 billion.
- Capital goods decreased $2.0 billion.
- Other industrial machinery decreased $0.4 billion.
- Civilian aircraft parts decreased $0.4 billion.
- Civilian aircraft decreased $0.2 billion.
- Civilian aircraft engines decreased $0.2 billion.
Exports of services decreased $10.8 billion to $59.6 billion in March.
- Travel decreased $7.5 billion.
- Transport decreased $2.6 billion.
Imports:
Imports of goods decreased $4.7 billion to $193.7 billion in March.
Imports of goods on a Census basis decreased $4.2 billion.
- Consumer goods decreased $4.0 billion.
- Cell phones and other household goods decreased $2.5 billion.
- Gem diamonds decreased $0.9 billion.
- Automotive vehicles, parts, and engines decreased $2.7 billion.
- Automotive parts and accessories decreased $1.5 billion.
- Passenger cars decreased $0.5 billion.
- Capital goods increased $1.5 billion.
- Computers increased $0.8 billion.
- Semiconductors increased $0.8 billion.
Imports of services decreased $10.7 billion to $38.5 billion in March.
- Travel decreased $7.7 billion.
- Transport decreased $2.9 billion.
The declines in March exports and imports were, in part, due to the impact of COVID-19, as many businesses were operating at limited capacity or ceased operations completely, and the movement of travelers across borders was restricted. The full economic effects of the COVID-19 pandemic cannot be quantified in the trade statistics for March because the impacts are generally embedded in source data and cannot be separately identified