|
Related Topics
|
|
Category: Inflation and Monetary Policy
Last Updated: 21 May 2020 This page is dedicated to the US Consumer Inflation Rate (CPI). We will be digging into the US inflation numbers on a regular basis to provide in depth details about the factors driving the inflation rate of the biggest economy in the world.
Real average hourly earnings for all employees on nonfarm payrolls increased 7.5 percent from April 2019 to April 2020. " |

|
21 May 2020: Producer price final demand index down 1.2 percent for the year ended April 2020
Looking at an update from the Bureau of Labor Statistics (BLS) regarding producer inflation for final demand goods they had the following to say. The Producer Price Index for final demand declined 1.2 percent for the 12 months ended in April 2020, after having increased 0.7 percent in in the 12 months ended in March. The April decline in final demand prices was the largest since a 1.3-percent decline for the 12 months ended November 2015.

Most of the broad-based decrease is attributable to prices for final demand energy, which fell 29.6 percent over the year. Final demand prices for gasoline dropped 67.0 percent. Prices for jet fuel, diesel fuel, and home heating oil also decreased. Prices for final demand goods less foods and energy increased 0.1 percent, which includes pharmaceutical prices up 2.1 percent and cigarette prices up 4.8 percent since April 2019. Prices for final demand foods increased 0.3 percent. Prices for fresh and dry vegetables and fresh fruits and melons both decreased by more than 7.0 percent, while meat prices rose 1.0 percent.
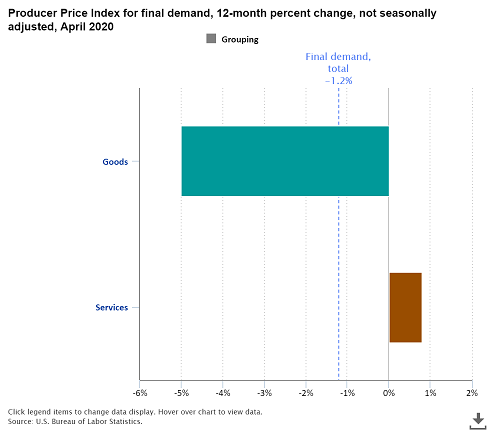
The index for final demand services fell 0.8 percent over the recent April-to-April period. Prices for final demand transportation and warehousing services declined 6.3 percent. Within the transportation grouping, prices for airline passenger services decreased 20.7 percent. Final demand services, less trade, transportation, and warehousing prices increased 0.3 percent, with prices for traveler accommodation services decreasing 17.8 percent, while outpatient care and inpatient care prices increased 1.6 and 3.2 percent, respectively. Margins for final demand trade services increased 3.4 percent.
18 May 2020: Real hourly earnings spike as lower paying jobs fall away due to Covid-19
So you might be wondering why we are looking at the increase in real hourly earnings. Well earnings growth usually leads to increased spending (which increases demand for goods and services) and economics 101 dictates that as demand increases if supply remains the same prices will increase. Increase in prices is also known as inflation. So lets take a look at what the Bureau of Labor Statistics (BLS) had to say regarding the increase in real average hourly earnings.
Real average hourly earnings for all employees on nonfarm payrolls increased 7.5 percent from April 2019 to April 2020. The change in real average hourly earnings combined with a decrease of 0.6 percent in the average workweek resulted in a 6.9-percent increase in real average weekly earnings over this period. The increase in real average hourly and weekly earnings largely reflects the substantial job loss in April among lower-paid workers. The Consumer Price Index for All Urban Consumers (CPI-U) rose 0.4 percent for the year ending April 2020.
Real average hourly earnings for all employees on nonfarm payrolls increased 7.5 percent from April 2019 to April 2020. The change in real average hourly earnings combined with a decrease of 0.6 percent in the average workweek resulted in a 6.9-percent increase in real average weekly earnings over this period. The increase in real average hourly and weekly earnings largely reflects the substantial job loss in April among lower-paid workers. The Consumer Price Index for All Urban Consumers (CPI-U) rose 0.4 percent for the year ending April 2020.
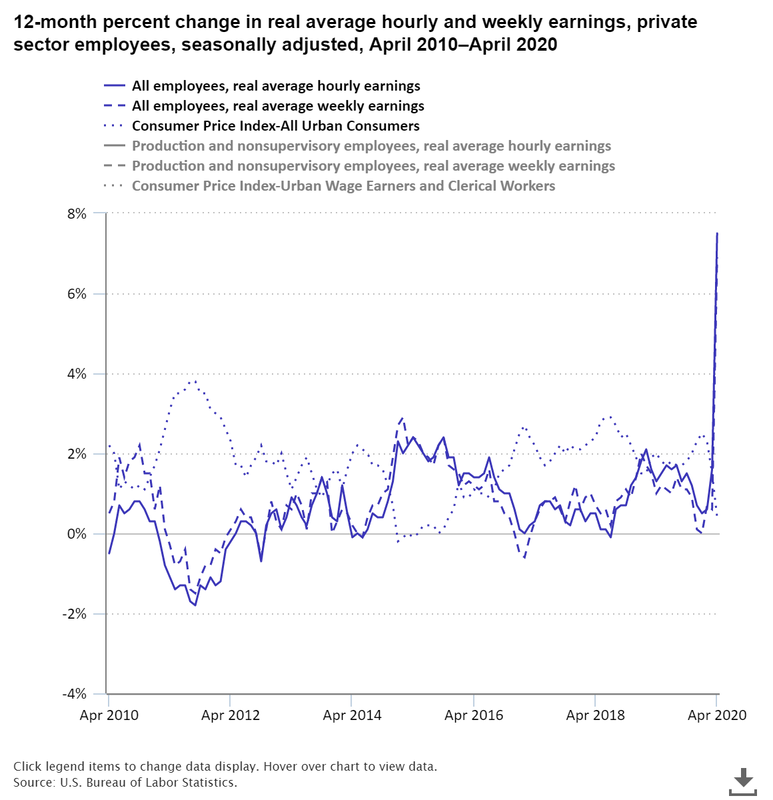
Real average hourly earnings for production and nonsupervisory employees increased 7.6 percent from April 2019 to April 2020. The change in real average hourly earnings combined with a decrease of 0.6 percent in the average workweek resulted in a 6.9-percent increase in real average weekly earnings over this period. The Consumer Price Index for Urban Wage Earners and Clerical Workers (CPI-W) rose 0.1 percent for the year ending April 2020
15 May 2020: Food at home prices spikes in April 2020
We take a look at a write up from the BLS covering some of the most significant moves of major product categories in the CPI basket for April 2020,
From April 2019 to April 2020, the Consumer Price Index for All Urban Consumers increased 0.3 percent, the smallest 12-month increase since October 2015. Over the 12 months ended April 2020, prices for all items less food and energy increased 1.4 percent, the smallest increase since April 2011. Energy prices fell 17.7 percent over the last year, the largest decline since the 12 months ending September 2015. In contrast, food prices rose 3.5 percent over the last 12 months. This was the largest 12-month increase since February 2012.
Food at home prices increased 4.1 percent over the 12 months ending April 2020, while prices for food away from home rose 2.8 percent. Gasoline prices decreased 32.0 percent and fuel oil prices fell 33.2 percent. Natural gas prices declined 1.9 percent, while electricity prices increased slightly, rising 0.2 percent.
Prices for all items less food and energy rose 1.4 percent from April 2019 to April 2020. Over that period, shelter prices rose 2.6 percent and medical care prices rose 4.8 percent. Prices decreased for airline fares (−24.3 percent), apparel (−5.7 percent), new vehicles (−0.6 percent), and used cars and trucks (−0.7 percent).
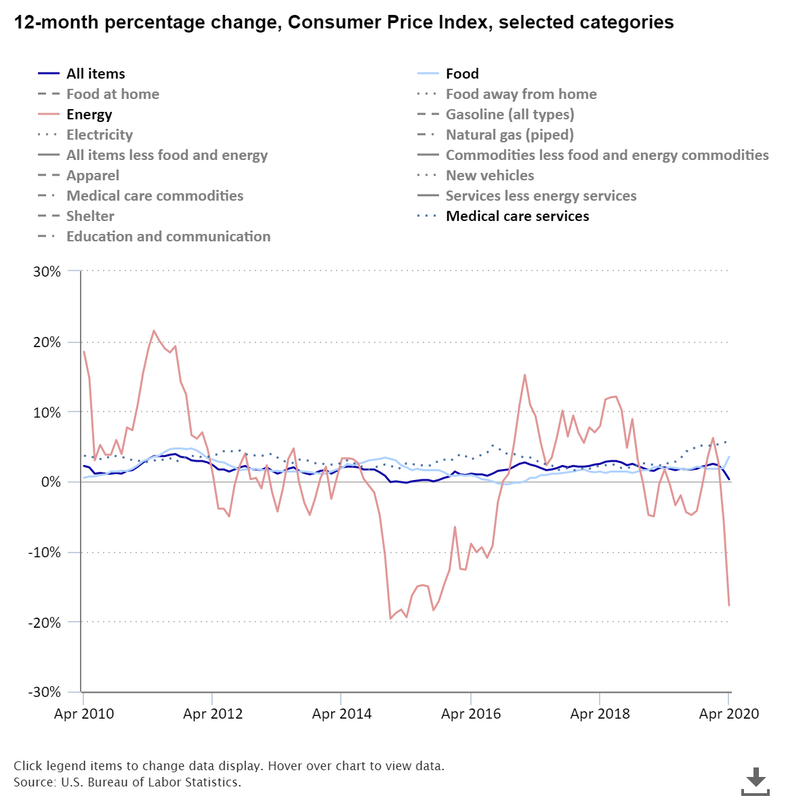
The graphic above shows the year on inflation rate of the US All item, Energy, Food and Medical Care Services. Energy prices saw a significant decline due to a large drop in the price of crude oil, while the prices for Food (that is consumed at home) increased sharply as demand for these products increased with lockdowns and stay at home orders across various states in the USA.
13 May 2020: US year on year inflation for April 2020 comes in at 0.3%
The short executive summary from the BLS covers the latest inflation numbers in the United States.
The Consumer Price Index for All Urban Consumers (CPI-U) declined 0.8 percent in April on a seasonally adjusted basis, the largest monthly decline since December 2008, the U.S. Bureau of Labor Statistics reported today.
Over the last 12 months, the all items index increased 0.3 percent before seasonal adjustment. A 20.6-percent decline in the gasoline index was the largest contributor to the monthly decrease in the seasonally adjusted all items index, but the indexes for apparel, motor vehicle insurance, airline fares, and lodging away from home all fell sharply as well. In contrast, food indexes rose in April, with the index for food at home posting its largest monthly increase since February 1974.
The energy index declined mostly due to the decrease in the gasoline index, though some energy component indexes rose. The index for all items less food and energy fell 0.4 percent in April, the largest monthly decline in the history of the series, which dates to 1957. Along with the indexes mentioned above, the indexes for used cars and trucks and recreation also declined. The indexes for rent, owners’ equivalent rent, medical care, and household furnishings and operations all increased in April. The all items index increased 0.3 percent for the 12 months ending April, the smallest 12-month increase since October 2015. The index for all items less food and energy increased 1.4 percent over the last 12 months, its smallest increase since April 2011. The energy index fell 17.7 percent over the last year. In contrast, the food index rose 3.5 percent over the last 12 months, its largest 12-month increase since February 2012.
The summary below shows the year on year (not seasonally adjusted) inflation rate of various product categories for the month April 2020
All items: 0.3%
Food: 3.5%
- Food at home: 4.1%
- Food away from home: 2.8%
- Energy commodities: -31.4%
- Gasoline (all types): -32.0%
- Fuel oil: -33.2%
- Energy services: -0.2%
- Electricity: 0.2%
- Utility (piped) gas service: -1.9%
- New vehicles: -0.6%
- Used cars and trucks: -0.7%
- Apparel: -5.7%
- Medical care commodities: 0.7%
- Shelter: 2.6%
- Transportation services: -5.5%
- Medical care services: 5.8%
27 April 2020: U.S City Averages compared to the South Region of the United States
In this update we take a look at the inflation rate of various categories of the South region and compare it to the overall U.S city averages. According to the Bureau of Labor Statistics (BLS) the supplier of the data, the South region is comprised of Alabama, Arkansas, Delaware, District of Columbia, Florida, Georgia, Kentucky, Louisiana, Maryland, Mississippi, North Carolina, Oklahoma, South Carolina, Tennessee, Texas, Virginia, and West Virginia.
For the categories looked at in the graphic above, the South Region of the US reported lower annual levels of inflation for all the categories compared to the overall U.S Cities average. The biggest difference between the South Region and the U.S cities inflation is medical care with medical care sitting at 4.7% in the U.S cities while its only 3.3% in the South Region.
16 April 2020: US March 2020 inflation came in at 1.5%
The Consumer Price Index for All Urban Consumers rose 1.5 percent from March 2019 to March 2020. That was a notably smaller increase than the 2.3-percent increase for the period ending February 2020. Consumer prices for energy fell 5.7 percent from March 2019 to March 2020, as gasoline prices declined 10.2 percent.
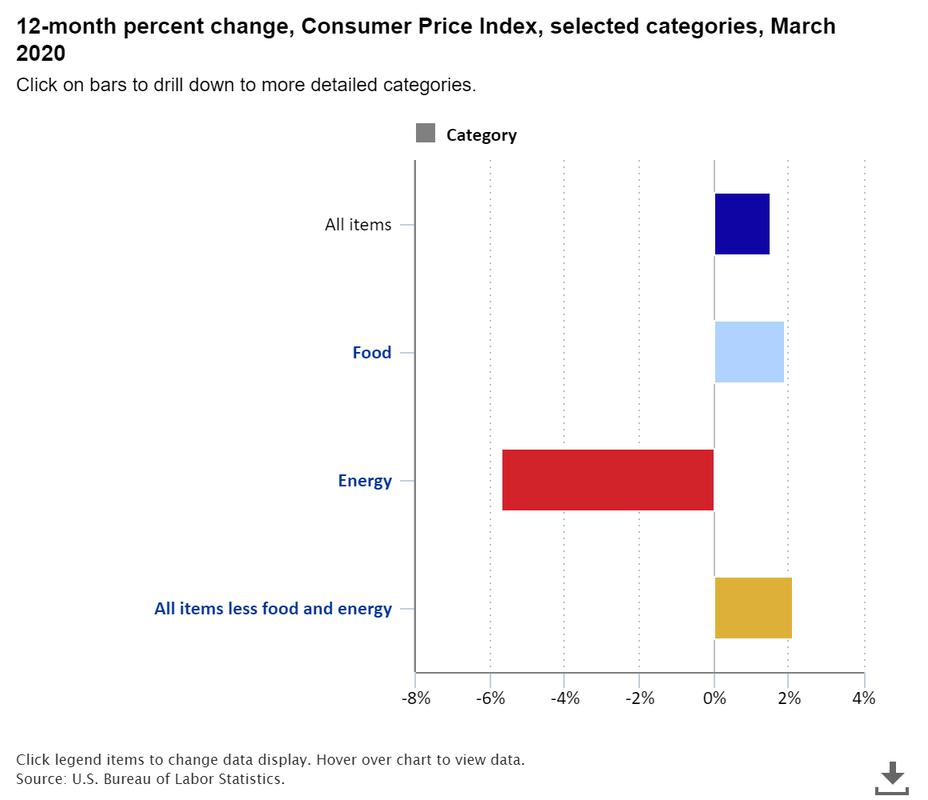
Prices declined 10.6 percent for airline fares and 6.4 percent for lodging away from home over the 12 months ended March 2020. Apparel prices fell 1.6 percent, while food prices rose 1.9 percent. Consumer prices for all items less food and energy rose 2.1 percent from March 2019 to March 2020.