|
Related Topics
|
|
Category: Stock Market and Brinker International
Date: 15 September 2019 Stock Price: $43.50 We take a look at the 4th quarter earnings release of their 2019 fiscal year of Brinker International, the owner for food franchise store Chili's and Maggiano's.
|
|
About Brinker International
Brinker International, Inc. is one of the world's leading casual dining restaurant companies. Based in Dallas, Texas, as of June 26, 2019, Brinker owned, operated, or franchised 1,665 restaurants under the names Chili's® Grill & Bar (1,612 restaurants) and Maggiano's Little Italy® (53 restaurants). Below an image of two storefronts representing Brinker International's two main brands.

Overview of Brinker International's latest earnings report
The numbers we are interested in (for the quarter):
- Total revenue: $834.1 million (up from $817.1 million from the same quarter of the previous year)
- Revenues increased by 2% over the last 12 months
- Total operating expenses: $770 million (up from $746.7 million for the same quarter of the previous year)
- Cost of revenues increased by 3.1% over the last 12 months
- Net income: $46.7 million (up from $43.8 million for the same quarter of the previous year)
- Diluted earnings per share: $1.22 (up from $1.01 for the same quarter of the previous year)
- Diluted weighted-average shares outstanding: 38.3 million (down from 43.5 million for the same quarter of the previous year)
- Cash and cash equivalents: $13.4 million
- Cash and cash equivalents per share: $0.349
- Cash and cash equivalents makes up 0.8% of Brinker International's market capital
- Cash and cash equivalents makes up 1.06% of Brinker International's total assets
- Cash generated from operations (for the full fiscal year): $212.7 million
- Cash generated from operations per share (for the full year): $5.53
Brinker International's management commentary on the results and earnings guidance
"The fourth quarter marked our 5th consecutive quarter of positive same store sales and our sixth consecutive quarter to out-perform the category in traffic", said Wyman Roberts, CEO and President. "Our continued focus on improving the guest experience and providing everyday value is a long term strategy that continues to deliver solid results."
QUARTERLY OPERATING PERFORMANCE
Company Sales and Company Restaurant Expenses
Chili's Company sales in the fourth quarter of fiscal 2019 increased 2.0% to $701.9 million from $688.2 million in the fourth quarter of fiscal 2018 primarily due to an increase in comparable restaurant sales driven by an increase in To Go sales. As compared to the fourth quarter of fiscal 2018, Chili's restaurant operating margin(1) declined. This was primarily driven by Chili's Restaurant expenses, as a percentage of Company sales, which increased compared to the fourth quarter of fiscal 2018 primarily due to higher rent expenses associated with the new operating leases entered into during fiscal 2019 as part of the sale leaseback transactions and the impact of adopting ASC 606, partially offset by sales leverage. Cost of sales, as a percentage of Company sales, increased compared to the fourth quarter of fiscal 2018 primarily due to unfavorable menu item mix and produce commodity pricing, partially offset by increased menu pricing. These increases were partially offset by Restaurant labor, as a percentage of Company sales, which decreased compared to the fourth quarter of fiscal 2018 due to lower manager expenses, lower employee health insurance expenses and sales leverage impact, partially offset by higher wage rates.
Maggiano's Company sales in the fourth quarter of fiscal 2019 decreased 0.3% to $102.9 million from $103.2 million in the fourth quarter of fiscal 2018 primarily due to a decrease in comparable restaurant sales. As compared to the fourth quarter of fiscal 2018, Maggiano's restaurant operating margin(1) declined. This was primarily driven by Cost of sales, as a percentage of Company sales, which increased compared to the fourth quarter of fiscal 2018 primarily due to unfavorable menu item mix and commodity pricing, partially offset by increased menu pricing. These increases were partially offset by a decrease in Restaurant labor, as a percentage of Company sales, primarily due to lower manager expenses, partially offset by sales deleverage. Restaurant expenses, as a percentage of Company sales remained flat compared to the fourth quarter of fiscal 2018.
FISCAL 2020 OUTLOOK
We estimate earnings per diluted share, excluding special items, will be in the range of $4.15 to $4.35. We believe providing estimated guidance for fiscal 2020 earnings per diluted share, excluding special items, provides investors the appropriate insight into our ongoing operating performance. Estimated earnings are based on the following:
We are unable to reliably forecast special items such as restaurant impairments, restaurant closures, reorganization charges and legal settlements without unreasonable effort. As such, we do not present a reconciliation of forecasted non-GAAP measures to the corresponding GAAP measures. If special items are reported during fiscal 2020, reconciliations to the appropriate GAAP measures will be provided.
QUARTERLY OPERATING PERFORMANCE
Company Sales and Company Restaurant Expenses
Chili's Company sales in the fourth quarter of fiscal 2019 increased 2.0% to $701.9 million from $688.2 million in the fourth quarter of fiscal 2018 primarily due to an increase in comparable restaurant sales driven by an increase in To Go sales. As compared to the fourth quarter of fiscal 2018, Chili's restaurant operating margin(1) declined. This was primarily driven by Chili's Restaurant expenses, as a percentage of Company sales, which increased compared to the fourth quarter of fiscal 2018 primarily due to higher rent expenses associated with the new operating leases entered into during fiscal 2019 as part of the sale leaseback transactions and the impact of adopting ASC 606, partially offset by sales leverage. Cost of sales, as a percentage of Company sales, increased compared to the fourth quarter of fiscal 2018 primarily due to unfavorable menu item mix and produce commodity pricing, partially offset by increased menu pricing. These increases were partially offset by Restaurant labor, as a percentage of Company sales, which decreased compared to the fourth quarter of fiscal 2018 due to lower manager expenses, lower employee health insurance expenses and sales leverage impact, partially offset by higher wage rates.
Maggiano's Company sales in the fourth quarter of fiscal 2019 decreased 0.3% to $102.9 million from $103.2 million in the fourth quarter of fiscal 2018 primarily due to a decrease in comparable restaurant sales. As compared to the fourth quarter of fiscal 2018, Maggiano's restaurant operating margin(1) declined. This was primarily driven by Cost of sales, as a percentage of Company sales, which increased compared to the fourth quarter of fiscal 2018 primarily due to unfavorable menu item mix and commodity pricing, partially offset by increased menu pricing. These increases were partially offset by a decrease in Restaurant labor, as a percentage of Company sales, primarily due to lower manager expenses, partially offset by sales deleverage. Restaurant expenses, as a percentage of Company sales remained flat compared to the fourth quarter of fiscal 2018.
FISCAL 2020 OUTLOOK
We estimate earnings per diluted share, excluding special items, will be in the range of $4.15 to $4.35. We believe providing estimated guidance for fiscal 2020 earnings per diluted share, excluding special items, provides investors the appropriate insight into our ongoing operating performance. Estimated earnings are based on the following:
- We expect to acquire 116 Chili's restaurants in the first quarter of fiscal 2020 from our franchisee, ERJ Dining. The impact of this acquisition has been included within the fiscal 2020 guidance provided
- Revenues are expected to be up approximately 9.0% to 10.0% primarily due to the acquisition of the 116 Chili's restaurants
- Comparable restaurant sales are expected to be up 1.75% to 2.50%
- Restaurant operating margin is expected to be down approximately 20 basis points to flat
- Capital expenditures are expected to be $140.0 million to $150.0 million
- General and administrative expense is expected to remain flat
- Excluding the impact of special items, the effective income tax rate is expected to be approximately 10.5% to 11.5%
- Free cash flow is expected to be $160.0 million to $175.0 million
- Effective fiscal 2020, we have adopted the new US GAAP leasing standard (Topic 842) using the cumulative effect transition method and therefore no prior periods will be restated. We do not expect the new leasing standard to have a significant impact on earnings. The impact of the new leasing standard has been included within the fiscal 2020 guidance provided
We are unable to reliably forecast special items such as restaurant impairments, restaurant closures, reorganization charges and legal settlements without unreasonable effort. As such, we do not present a reconciliation of forecasted non-GAAP measures to the corresponding GAAP measures. If special items are reported during fiscal 2020, reconciliations to the appropriate GAAP measures will be provided.
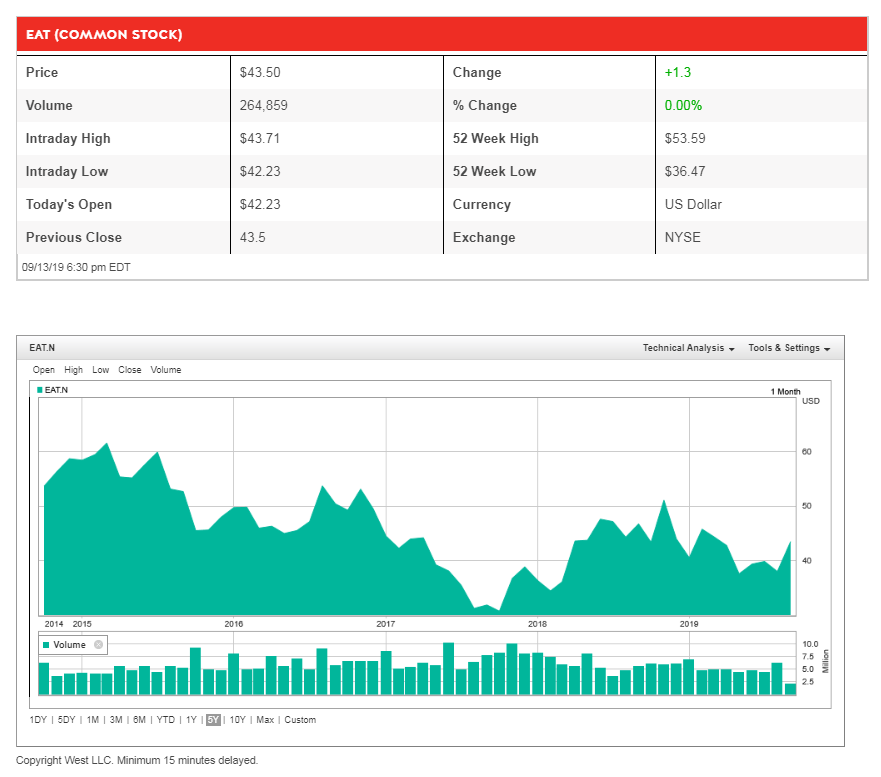
Brinker International (NYSE: EAT) stock price history
The image below shows the stock price history of Brinkers International (NYSE: EAT) for the last 5 years. And its not been a good time for EAT stockholders. 5 years ago the stock was trading at $50 a stock and its currently trading at $43.50. That is a negative return of 13%. And while the return is not that negative, the opportunity cost of holding Brinkers stock while other stocks we valued recently saw returns of well above 100% over the same period is significant. Brinkers International's stock is also trading at a lot closer to it 52 week low than it is to its 52 week high, another indication that short term sentiment and momentum of the stock being negative.
Recent coverage of Brinker International
The extract below shows recent coverage of Brinker International as obtained from Zacks
Value investing is always a very popular strategy, and for good reason. After all, who doesn’t want to find stocks that have low PEs, solid outlooks, and decent dividends? Fortunately for investors looking for this combination, we have identified a strong candidate which may be an impressive value; Brinker International, Inc. (EAT - Free Report) .
Brinker in Focus
EAT may be an interesting play thanks to its forward PE of 9.8, its P/S ratio of 0.5, and its decent dividend yield of 3.8%. These factors suggest that Brinker is a pretty good value pick, as investors have to pay a relatively low level for each dollar of earnings, and that EAT has decent revenue metrics to back up its earnings.
But before you think that Brinker is just a pure value play, it is important to note that it has been seeing solid activity on the earnings estimate front as well. For current year earnings, the consensus has gone up by 2.7% in the past 30 days, thanks to six upward revision in the past one months compared to none lowers. This estimate strength is actually enough to push EAT to a Zacks Rank #3 (Hold), suggesting it is poised to outperform.
So really, Brinker is looking great from a number of angles thanks to its PE below 20, a P/S ratio below one, and a strong Zacks Rank, meaning that this company could be a great choice for value investors at this time.
Read the full article here
Brinker International (NYSE: EAT) latest stock valuation
So based on the earnings report of Brinker International (NYSE: EAT) and their fiscal outlook provided for 2020 what do we value Brinker International stock at? Based on the earnings reported and the fiscal guidance provided our valuation model provides a target (full value) price for Brinker International (EAT) at $66.40 a stock. We therefore feel that the stock is undervalued and believe it offers long term fundamental or value investors a great buying opportunity into the group's stock. We therefore rate Brinkers International (NYSE: EAT) as a buy.