
|
Related Topics
|
|
Category: Stock Market and Buckle Inc (BKE)
Date: 22 November 2020 Stock Price of Buckle (BKE): $27.81 We take a look at the 3rd quarter earnings report of their 2020 fiscal year of Buckle Inc, an on-trend apparel retailer with 449 stores in 42 states across the USA. For the quarter the group reported sales of $251 million and net income of $41.6 million
|
|
Comparable store net sales for the 13-week period ended October 31, 2020 increased 12.4 percent from comparable store net sales for the prior year 13-week period ended November 2, 2019. Online sales increased 72.5 percent to $46.4 million for the 13-week period ended October 31, 2020 "
About Buckle Inc.
Offering a unique mix of high-quality, on-trend apparel, accessories, and footwear, Buckle caters to fashion-conscious young men and women. Known as a denim destination, each store carries a wide selection of fits, styles, and finishes from leading denim brands, including the Company’s exclusive brand, BKE. Headquartered in Kearney, Nebraska, Buckle currently operates 449 retail stores in 42 states. As of the end of the fiscal quarter, it operated 449 stores in 42 states compared with 453 stores in 43 states at the end of the third quarter of fiscal 2018.

A group of young people wearing apparel from Buckle
Overview of Buckle's 3rd quarter 2020 earnings report
Data below refers to the latest quarter's data unless specified otherwise:
- Net sales: $251 million (up from $224 million for the same quarter of the prior year)
- Net sales increased by 12% over the last 12 months
- Cost of sales : $134.1 million (up from $130.6 million for the same quarter of the prior year)
- Cost of sales expenses increased by 2.7% over the last 12 months
- So margin gain for Buckle as revenue increased at a rate a lot faster than their cost of sales which is good for margins and profits
- Net income: $41.6 million (up from $25.9 million for the same quarter of the prior year)
- Diluted earnings per share: $0.85 (up from $0.53 for the same quarter of the prior year)
- Shares outstanding : 48.9 million (up from 48.8 million for the same quarter of the prior year)
- Cash and cash equivalents: $331.9 million
- Cash and cash equivalents per share: $6.78
- Cash and cash equivalents makes up 24.4% of Buckle's market capital
- Cash and cash equivalents makes up 36.9% of Buckle's total assets
- Merchandise inventories: $118.7 million
- Merchandise inventories makes up 13.2% of Buckle's total assets
- Stockholders equity in Buckle: $442.4 million
- Stockholders equity per Buckle stock: $9.04
- Buckle is trading at 3.07 times its stockholders equity per share which is just within the expected range of between 2 and 4 times that most firms tend to trade at
- Firms in the S&P 500 trades at an average price to book value of 3.9.
Buckle's management commentary on their 3rd quarter 2020 earnings
KEARNEY, NE --The Buckle, Inc. (NYSE: BKE) announced today that net income for the fiscal quarter ended October 31, 2020 was $41.6 million, or $0.85 per share ($0.85 per share on a diluted basis). Net sales for the 13-week fiscal quarter ended October 31, 2020 increased 12.0 percent to $251.0 million from net sales of $224.1 million for the prior year 13-week fiscal quarter ended November 2, 2019. Comparable store net sales for the 13-week period ended October 31, 2020 increased 12.4 percent from comparable store net sales for the prior year 13-week period ended November 2, 2019. Online sales increased 72.5 percent to $46.4 million for the 13-week period ended October 31, 2020, compared to net sales of $26.9 million for the 13-week period ended November 2, 2019
Net sales for the 39-week fiscal period ended October 31, 2020 decreased 7.4 percent to $582.4 million from net sales of $629.3 million for the prior year 39-week fiscal period ended November 2, 2019. Comparable store net sales for the 39-week period ended October 31, 2020 decreased 7.1 percent from comparable store net sales for the prior year 39 -week period ended November 2, 2019. Online sales increased 67.3 percent to $124.4 million for the 39-week period ended October 31, 2020, compared to net sales of $74.4 million for the 39-week period ended November 2, 2019.
Net income for the third quarter of fiscal 2020 was $41.6 million, or $0.85 per share ($0.85 per share on a diluted basis), compared with $26.0 million, or $0.54 per share ($0.53 per share on a diluted basis) for the third quarter of fiscal 2019. Net income for the 39-week fiscal period ended October 31, 2020 was $64.5 million, or $1.32 per share ($1.32 per share on a diluted basis), compared with $57.5 million, or $1.18 per share ($1.18 per share on a diluted basis) for the 39-week period ended November 2, 2019.
Net income for the third quarter of fiscal 2020 was $41.6 million, or $0.85 per share ($0.85 per share on a diluted basis), compared with $26.0 million, or $0.54 per share ($0.53 per share on a diluted basis) for the third quarter of fiscal 2019. Net income for the 39-week fiscal period ended October 31, 2020 was $64.5 million, or $1.32 per share ($1.32 per share on a diluted basis), compared with $57.5 million, or $1.18 per share ($1.18 per share on a diluted basis) for the 39-week period ended November 2, 2019.
Buckle Inc. (BKE) stock price history over the last 5 years
The image below obtained from Google, shows the stock price history of Buckle Inc. (BKE) for the last 5 years, and its not been the best time for Buckle stockholders. 5 years ago the stock of Buckle was trading at around $32.80 and its currently trading at $27.81 a stock. That's a loss of -15.1% suffered by Buckle Inc stockholders.
The stock of Buckle is trading at a lost closer to its 52 week high than it is to its 52 week low which is a clear indication that the short term sentiment and momentum of Buckle's stock is positive at this point in time.
The stock of Buckle is trading at a lost closer to its 52 week high than it is to its 52 week low which is a clear indication that the short term sentiment and momentum of Buckle's stock is positive at this point in time.
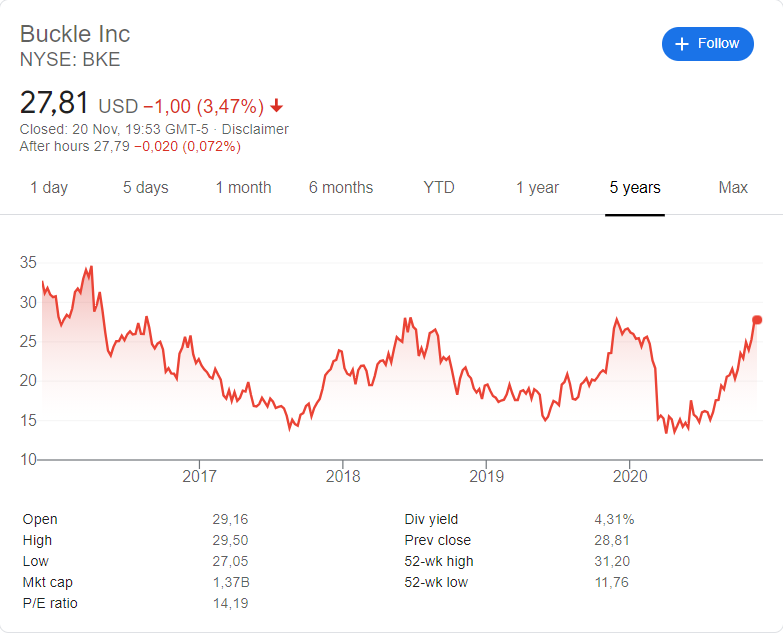
Buckle Inc. (BKE) stock price history over the last 5 years.
Buckle (BKE) vs Abercrombie & Fitch (ANF) stock over the last 5 years
The image below shows the stock price performance of Buckle (BKE) vs Abercrombie & Fitch (ANF) stock over the last 5 years. Both are active in the on trend apparel sector. The summary below shows the stock price performance of these two firms over the last 5 years.
While both stocks have yielded negative returns over the last 5 years Buckle's stock has been a slightly better performance
- Buckle (BKE): -15.1%
- Abercrombie & Fitch (ANF): -19.4%
While both stocks have yielded negative returns over the last 5 years Buckle's stock has been a slightly better performance
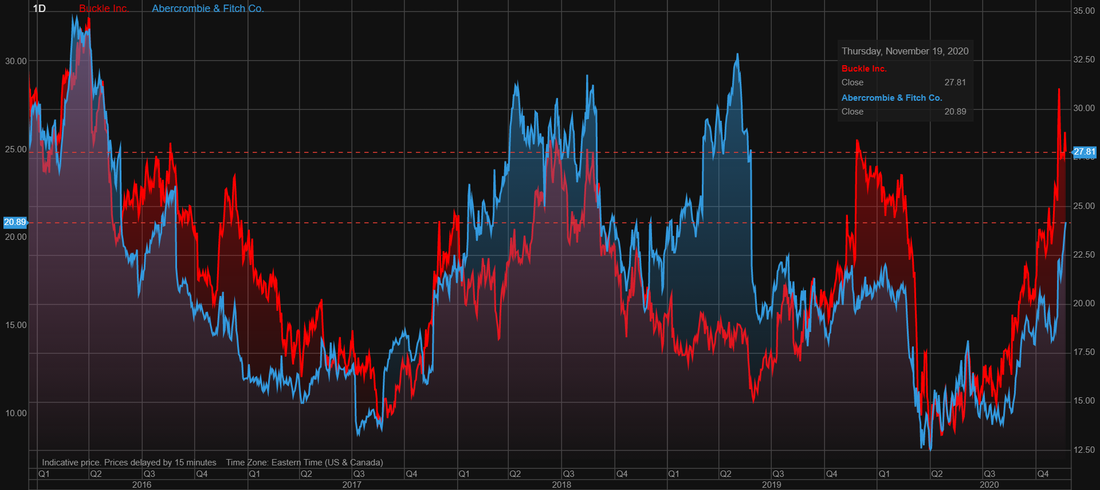
Buckle (BKE) vs Abercrombie & Fitch (ANF) stock over the last 5 years
Recent coverage of Buckle Inc
The extract below covers the latest regarding Buckle as obtained from Nasdaq.com
Momentum investing revolves around the idea of following a stock's recent trend in either direction. In the 'long' context, investors will be essentially be "buying high, but hoping to sell even higher." With this methodology, taking advantage of trends in a stock's price is key; once a stock establishes a course, it is more than likely to continue moving that way. The goal is that once a stock heads down a fixed path, it will lead to timely and profitable trades.
While many investors like to look for momentum in stocks, this can be very tough to define. There is a lot of debate surrounding which metrics are the best to focus on and which are poor quality indicators of future performance. The Zacks Momentum Style Score, part of the Zacks Style Scores, helps address this issue for us.
Below, we take a look at Buckle (BKE), which currently has a Momentum Style Score of A. We also discuss some of the main drivers of the Momentum Style Score, like price change and earnings estimate revisions.
It's also important to note that Style Scores work as a complement to the Zacks Rank, our stock rating system that has an impressive track record of outperformance. Buckle currently has a Zacks Rank of #2 (Buy). Our research shows that stocks rated Zacks Rank #1 (Strong Buy) and #2 (Buy) and Style Scores of A or B outperform the market over the following one-month period.
Read the full article here
Buckle store front. Image obtained from Medium.com
Buckle Inc. (NYSE: BKE) stock valuation
So based on Buckle's latest earnings report what do we value the company's stock at? Based on Buckle's earnings report our valuation model we have a target (full value) price for Buckle's at $29.30 a stock (up from 1st quarter 2020 earnings report valuation of Buckle). We therefore believe the stock of Buckle is fullyvalued.
We usually recommend that long term fundamental or value investors look to enter a stock at least 10% below our target price (full value price) which in this case is $29.30. A good entry point into the stock of Buckle would therefore be at $26.40 or below.
Since the stock of Buckle's is trading at close our suggested entry point we rate Buckle as a hold
Next earnings release of Buckle Inc (NYSE: BKE)
It is expected that Buckle Inc. will release their 4th quarter 2020 earnings report towards the middle of February 2021