|
Related Topics
|
|
Category: Dow Jones, Nasdaq and S&P 500
Date: 18 July 2020 We take a look at the performance of the Dow Jones, Nasdaq and S&P 500 for the week ending 17 July 2020. The markets continue to be worried about the continued rise in Covid-19 cases across the world. Earnings season was also kicked off by some of the major US banks. We covered three of these banks in our battle of the banks article.
|

|
Warren Buffett the world's best known investor said, be greedy when others are fearful, be fearful when others are greedy. Basically sell offs providing buying opportunities for savvy investors. Note buying opportunities. Not selling opportunities."
Dow Jones, Nasdaq and S&P 500 all recorded modest increases for the week ending 10 July 2020
The image below shows the returns of the Dow Jones (DJIA), Nasdaq and S&P 500 over the last week (13 July 2020 to 17 July 2020). The week that was was relatively mixed bag and was the opposite of what we have seen in recent weeks, months and years. More about this below the graphic
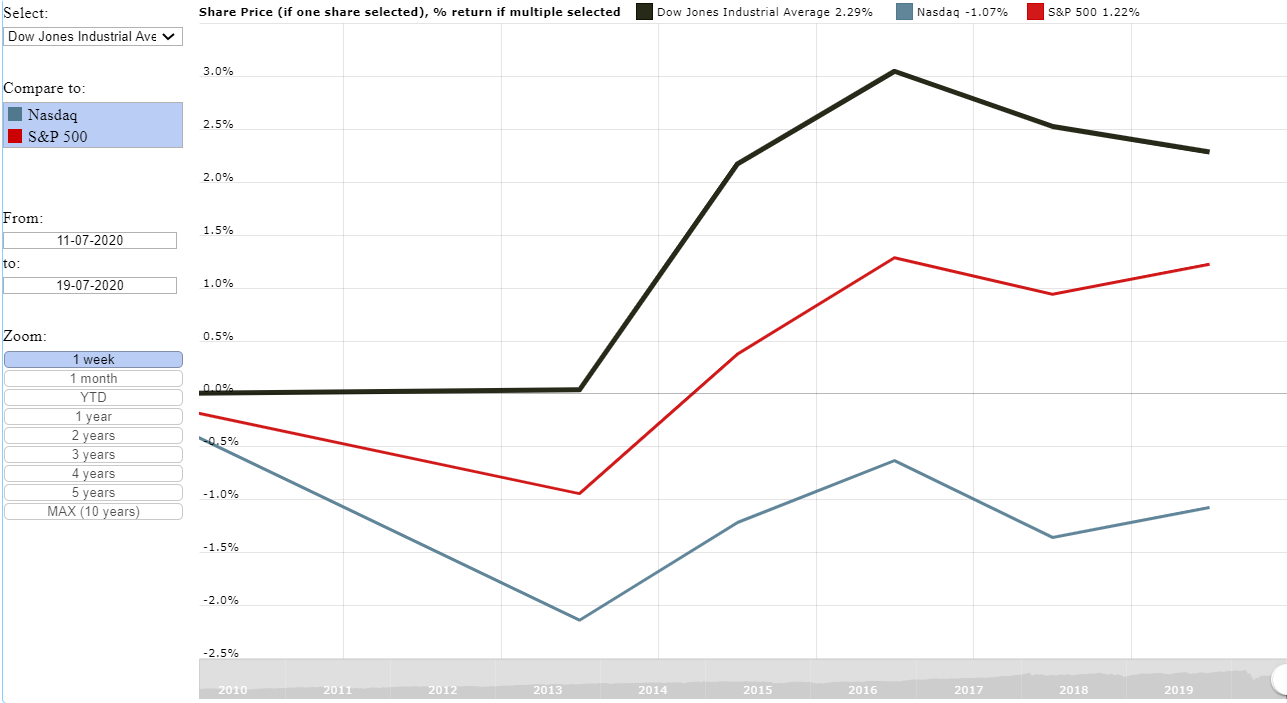
Graph of the Dow Jones, Nasdaq and S&P 500 performance for the week ending 17 July 2020
And in a rare turn of events, for the trading week ending 17 July 2020 the Dow Jones and S&P 500 outperformed the Nasdaq. In our recent studies and other week ending performance articles the Nasdaq and S&P 500 tended to outperform the Dow. The weak performance of the Nasdaq this week is a clear sign that there was some sector rotation taking place during the week and money moved out of the tech heavy Nasdaq into other sectors.
Below the returns of the main market indices over the last week, 13 July 2020 to 17 July 2020 (sorted from best performer to worst performer)
We are however surprised at the current strength of the financial markets considering the fact that there is an alarming spike in the number of coronavirus cases in the the United States. This will have a negative impact on businesses, consumers and the health care sector in general. The impact of Covid-19 on consumers can already be seen in the earnings reported by banks in which the major banks made massive provisions for credit losses and write offs. See more at JPMorgan Chase and CitiGroup earnings reports.
Below the returns of the main market indices over the last week, 13 July 2020 to 17 July 2020 (sorted from best performer to worst performer)
- Dow Jones: 2.29%
- S&P 500: 1.22%
- Nasdaq: -1.07%
We are however surprised at the current strength of the financial markets considering the fact that there is an alarming spike in the number of coronavirus cases in the the United States. This will have a negative impact on businesses, consumers and the health care sector in general. The impact of Covid-19 on consumers can already be seen in the earnings reported by banks in which the major banks made massive provisions for credit losses and write offs. See more at JPMorgan Chase and CitiGroup earnings reports.
So lets take a look at some of the major market events during the last week
17 July 2020: The Dow Jones ended the day, 17 July down by -0.23%
Dow Jones Updates:
Website Updates:
Yesterday we covered the latest earnings report from Domino's Pizza. Below an extract from the Domino's Pizza earnings review
So what is Domino's Pizza (NYSE: DPZ) stock worth based on the release of their 2nd quarter 2020 earnings report? Based on Domino's Pizza's 2nd quarter 2020 earnings report our valuation model provides a target price (full value price) at $209.40 a stock. We therefore believe that the stock is overvalued.
We usually suggest long term fundamental or value investors look to enter into a stock at least 10% below our target price (full value price) which in this case is $209.40. Thus we see a good entry point into Domino's stock at $188.50 or below. We believe that Domino's stock will pull back in coming weeks and months to levels closer to our target price (full value price).
Read the full article here
16 July 2020: The Dow Jones ended the day down by -0.5%
Dow Jones Updates:
Website Updates:
We covered the latest earnings release of of JP Morgan Chase (JPM), Bank of New York Mellon (BK) and CitiGroup (C) and then compared the banks against one another in our Battle of the Banks article. Below a short extract of that article
One of our key metrics is the Price to Stockholders equity per share ratio. When looking at this we find the following:
Based on this metric CitiGroup offers far more value than Bank of New York Mellon or JP Morgan. Most firms tend to trade at a ratio of between 2 and 4 times. While all these firms are trading at well below the expected range its Citi who is trading at the lowest and based on this metric offers the most value.
Next up cash as percentage of stock price:
Next up lets take a look at the percentage cash on the balance sheet makes up of each group's total assets:
Looking at the cash position of the three banks Bank of New York Mellon has the strongest cash position (as a percentage of their total assets). The cash per share gives an indication of if investors were to buy the stock now, how much of that stock price is made up by cash on their balance sheet. In this case its CitiGroup that comes out on top with almost 22% of their current stock price being made up by cash.
Lastly the overused but still useful metric, the Price to Earnings Ratio (PE):
So BNY has the lowest PE and CitiGroup by far the highest. So all things considered if we have to choose between these three banking stocks and buy on right now based on their latest earnings reported and current stock price levels we will go for Bank of New York Mellon (BK). Therefore in our battle of the banks we declare Bank of New York Mellon as the WINNER
Read the full article here
15 July 2020: The Dow ended the 15th of July 2020 up by 0.83%
Dow Jones Updates:
Website Updates:
We covered the latest earnings release of of JP Morgan Chase (JPM). Below a short extract of that article
So what is JP Morgan Chase stock worth based on the release of their latest earnings report? Based on JP Morgan Chase latest earnings report our valuation models provide a target (full value) price for JP Morgan Chase stock at $127.70 a stock (down from our 1st quarter 2020 earnings report valuation of JP Morgan Chase). We therefore believe that the stock of JP Morgan Chase is undervalued at its current price of around $98. The sharp sell off in world markets and JP Morgan's stock price in recent months has provided investors with a good long term buying opportunity.
We usually suggest that long term and fundamental investors get in at least 10% below our target price (full value price) which in this case is $127.70 Therefore we believe a good entry point into JP Morgan Chase's stock is at $114.90 or below.
We expect the stock of JP Morgan Chase to surge once world economies starts reopening after the Covid-19 pandemic eases.
Read the full article here
14 July 2020: The Dow Jones ended the day, 14 July up by 2.13%
Dow Jones Updates:
Website Updates:
We covered the latest earnings release of of PepsiCo. Below a short extract of that article
So what is PepsiCo (NASDAQ: PEP) stock worth based on the release of their latest earnings report and fiscal guidance provide? Based on their earnings report and the guidance provided our valuation models provide a target (full value) price for PepsiCo of $138.70 a stock. We therefore believe that the stock is close to being fully valued.
We usually suggest long term investors look to enter a stock at least 10% below our target (full value) price which in this case is $138.70. So a good entry point into PepsiCo stock would be at $124.80 or below. We therefore rate the stock of PepsiCo (PEP) as a hold.
Read the full article here
13 July 2020: The Dow Jones ended the day 13 July up by 0.05%
Dow Jones Updates:
Website Updates:
So what is Kohl's stock worth based on their 1st quarter 2020 earnings report? Based on their earnings report our valuation model provides a target price (full value price) for Kohl's at $57.60 a stock. We therefore believe the stock of Kohl's is undervalued
We usually recommend long term fundamental or value investors look to enter a stock at least 10% below our target (full value) price, which in this case is $57.60 thus a good entry point into Kohl's would be at $51.90 or below.
We expect the stock of Kohl's stock price to recover in coming weeks and months as the Covid-19 pandemic subsides to levels closer to our target price (full value price). Since the stock of Kohl's is trading at well below our suggested entry point we rate the stock of Kohl's as a Buy
Read the full article here
Dow Jones Updates:
- (11:15 ET): Dow Jones is currently trading down by -0.08%
- (06:38 ET): Dow Jones futures are currently trading up by 0.28%
- (04:41 ET): Dow Jones futures are currently trading up by 0.06%
Website Updates:
Yesterday we covered the latest earnings report from Domino's Pizza. Below an extract from the Domino's Pizza earnings review
So what is Domino's Pizza (NYSE: DPZ) stock worth based on the release of their 2nd quarter 2020 earnings report? Based on Domino's Pizza's 2nd quarter 2020 earnings report our valuation model provides a target price (full value price) at $209.40 a stock. We therefore believe that the stock is overvalued.
We usually suggest long term fundamental or value investors look to enter into a stock at least 10% below our target price (full value price) which in this case is $209.40. Thus we see a good entry point into Domino's stock at $188.50 or below. We believe that Domino's stock will pull back in coming weeks and months to levels closer to our target price (full value price).
Read the full article here
16 July 2020: The Dow Jones ended the day down by -0.5%
Dow Jones Updates:
- (11:51 ET): Dow Jones is currently down by -0.46% so a mildly negative day
- (6:35 ET): Dow Jones futures are currently trading down by -0.56%. Signaling that markets will probably open on a relatively negative note
Website Updates:
We covered the latest earnings release of of JP Morgan Chase (JPM), Bank of New York Mellon (BK) and CitiGroup (C) and then compared the banks against one another in our Battle of the Banks article. Below a short extract of that article
One of our key metrics is the Price to Stockholders equity per share ratio. When looking at this we find the following:
- Price/Stockholders equity per share for CitiGroup: 0.602
- Price/Stockholders equity per share for JP Morgan : 1.11
- Price/Stockholders equity per share for Bank of New York Mellon: 0.73
Based on this metric CitiGroup offers far more value than Bank of New York Mellon or JP Morgan. Most firms tend to trade at a ratio of between 2 and 4 times. While all these firms are trading at well below the expected range its Citi who is trading at the lowest and based on this metric offers the most value.
Next up cash as percentage of stock price:
- Cash as percentage of stock price for CitiGroup: 21.8%
- Cash as percentage of stock price for JP Morgan : 6.7%
- Cash as percentage of stock price for Bank of New York Mellon: 14.8%
Next up lets take a look at the percentage cash on the balance sheet makes up of each group's total assets:
- Cash as percentage of stock price for CitiGroup: 1.05%
- Cash as percentage of stock price for JP Morgan : 0.64%
- Cash as percentage of stock price for Bank of New York Mellon: 1.1%
Looking at the cash position of the three banks Bank of New York Mellon has the strongest cash position (as a percentage of their total assets). The cash per share gives an indication of if investors were to buy the stock now, how much of that stock price is made up by cash on their balance sheet. In this case its CitiGroup that comes out on top with almost 22% of their current stock price being made up by cash.
Lastly the overused but still useful metric, the Price to Earnings Ratio (PE):
- PE for CitiGroup: 25.2
- PE for JP Morgan : 17.8
- PE for Bank of New York Mellon: 8.9
So BNY has the lowest PE and CitiGroup by far the highest. So all things considered if we have to choose between these three banking stocks and buy on right now based on their latest earnings reported and current stock price levels we will go for Bank of New York Mellon (BK). Therefore in our battle of the banks we declare Bank of New York Mellon as the WINNER
Read the full article here
15 July 2020: The Dow ended the 15th of July 2020 up by 0.83%
Dow Jones Updates:
- (14:41 ET): Dow Jones is currently trading up by 0.80%.
- (12:00 ET): Dow Jones is currently trading up by 0.55%.
- (09:00 ET): Dow Jones futures are currently trading up by 2.04%. Signaling that markets will open on a very positive note
- (3:52 ET): Dow Jones futures are currently trading up by 0.92%. Signaling that markets will probably open on a relatively positive note
Website Updates:
We covered the latest earnings release of of JP Morgan Chase (JPM). Below a short extract of that article
So what is JP Morgan Chase stock worth based on the release of their latest earnings report? Based on JP Morgan Chase latest earnings report our valuation models provide a target (full value) price for JP Morgan Chase stock at $127.70 a stock (down from our 1st quarter 2020 earnings report valuation of JP Morgan Chase). We therefore believe that the stock of JP Morgan Chase is undervalued at its current price of around $98. The sharp sell off in world markets and JP Morgan's stock price in recent months has provided investors with a good long term buying opportunity.
We usually suggest that long term and fundamental investors get in at least 10% below our target price (full value price) which in this case is $127.70 Therefore we believe a good entry point into JP Morgan Chase's stock is at $114.90 or below.
We expect the stock of JP Morgan Chase to surge once world economies starts reopening after the Covid-19 pandemic eases.
Read the full article here
14 July 2020: The Dow Jones ended the day, 14 July up by 2.13%
Dow Jones Updates:
- (15:41 ET): Dow Jones is currently trading up by 1.87%.
- (11:49 ET): Dow Jones is currently trading up by 1.13%.
- (9:39ET): Dow Jones is currently trading up by 0.05%.
- (7:29ET): Dow Jones futures are currently trading up by 0.44%.
- (1:09 ET): Dow Jones futures are currently trading up by 0.63%. Signaling that markets will probably open on a relatively positive note
Website Updates:
We covered the latest earnings release of of PepsiCo. Below a short extract of that article
So what is PepsiCo (NASDAQ: PEP) stock worth based on the release of their latest earnings report and fiscal guidance provide? Based on their earnings report and the guidance provided our valuation models provide a target (full value) price for PepsiCo of $138.70 a stock. We therefore believe that the stock is close to being fully valued.
We usually suggest long term investors look to enter a stock at least 10% below our target (full value) price which in this case is $138.70. So a good entry point into PepsiCo stock would be at $124.80 or below. We therefore rate the stock of PepsiCo (PEP) as a hold.
Read the full article here
13 July 2020: The Dow Jones ended the day 13 July up by 0.05%
Dow Jones Updates:
- (07:47 ET): The Dow Jones futures are currently up by 0.81%.
- (3:02 ET): Dow Jones futures are currently trading down by 0.63%. Signaling that markets will probably open on a relatively negative note
Website Updates:
So what is Kohl's stock worth based on their 1st quarter 2020 earnings report? Based on their earnings report our valuation model provides a target price (full value price) for Kohl's at $57.60 a stock. We therefore believe the stock of Kohl's is undervalued
We usually recommend long term fundamental or value investors look to enter a stock at least 10% below our target (full value) price, which in this case is $57.60 thus a good entry point into Kohl's would be at $51.90 or below.
We expect the stock of Kohl's stock price to recover in coming weeks and months as the Covid-19 pandemic subsides to levels closer to our target price (full value price). Since the stock of Kohl's is trading at well below our suggested entry point we rate the stock of Kohl's as a Buy
Read the full article here
Chart of the Dow Jones Industrial Average (DJIA) vs Nasdaq vs S&P500 over last 10 years
The graphic below shows the performance of the Dow Jones Industrial Average (DJIA) index over the last month. As soon as a user clicks on the Nasdaq or S&P500 the graphic recalculates and shows the returns of the additional indices selected. The graphic will recalculate the returns if users provide their own dates, within the last 10 year (or they can select predefined dates from our Zoom box in the graphic). Data for the graphic obtained from MacroTrends.Net
Below the returns of the main market indices over the last 12 months (sorted from best performer to worst performer)
So from the above its is clear that the Nasdaq has easily outperformed other major indices such as the S&P 500 and The Dow Jones over the last 12 months. The same can be said about the 2 year performance, 3 year performance, 5 year performance and 10 year performance, as tech giants listed on the Nasdaq has been driving the performance of the Nasdaq.
Below a summary of the returns provided by the three major US stock market indices over the last 10 years:
- Nasdaq: 26.08%
- S&P 500: 6.55%
- Dow Jones (DJIA): -1.92%
So from the above its is clear that the Nasdaq has easily outperformed other major indices such as the S&P 500 and The Dow Jones over the last 12 months. The same can be said about the 2 year performance, 3 year performance, 5 year performance and 10 year performance, as tech giants listed on the Nasdaq has been driving the performance of the Nasdaq.
Below a summary of the returns provided by the three major US stock market indices over the last 10 years:
- Nasdaq: 338%
- S&P 500: 175.7%
- Dow Jones (DJIA): 145.7%