|
Related Topics
|
|
Category: Dow Jones, Nasdaq and S&P500
Date: 20 June 2020 We take a look at the performance of the Dow Jones, Nasdaq and S&P500 for the week ending 19 June 2020. The week was dominated by renewed fears of a second wave of coronavirus cases and continued promises by the Federal Reserve to keep buying bonds and providing liquidity to the markets.
|

|
Warren Buffett the world's best known investor said, be greedy when others are fearful, be fearful when others are greedy. Basically sell offs providing buying opportunities for savvy investors. Note buying opportunities. Not selling opportunities."
Dow Jones, Nasdaq and S&P 500 all recorded declines for the week
The image below shows the returns of the Dow Jones (DJIA), Nasdaq and S&P 500 over the last week (15 June 2020 to 19 June 2020). As the graphic shows all three major US market indices recorded moderate increases for the week ending 19 June 2020
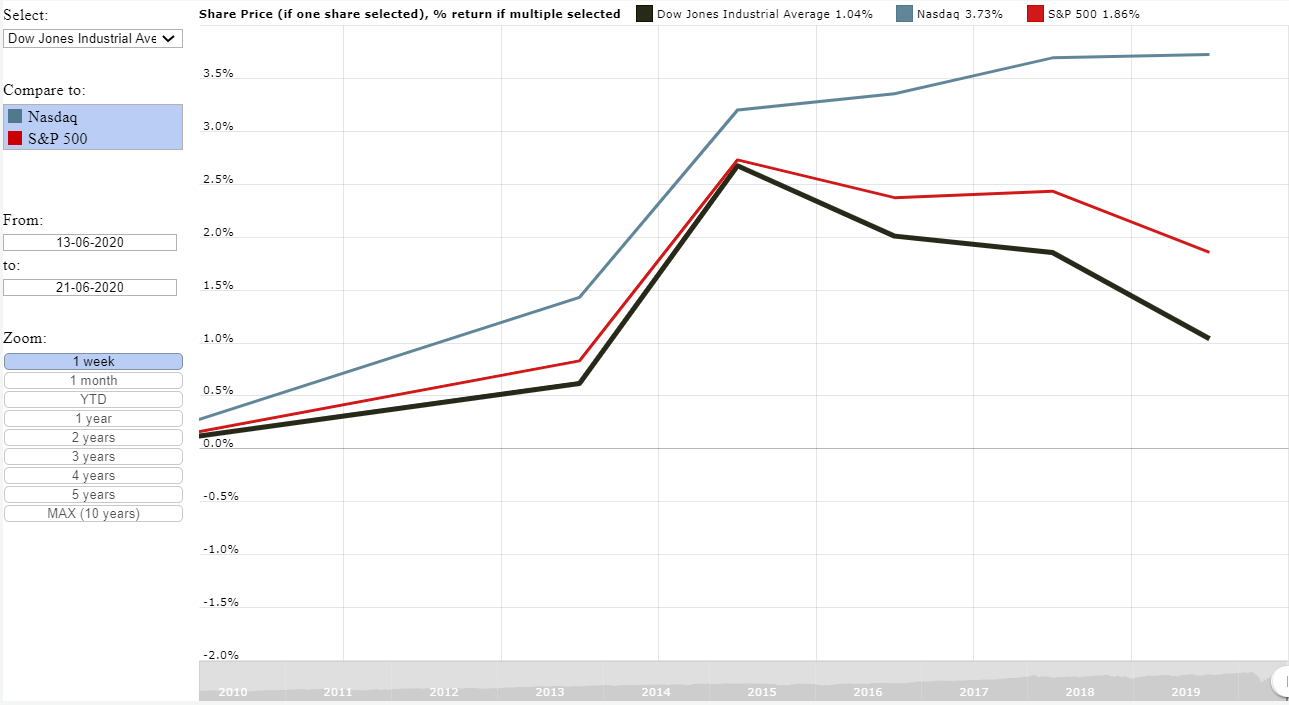
Dow Jones, Nasdaq and S&P 500 performance for the week ending 19 June 2020
Below the returns of the main market indices over the last week (sorted from best performer to worst performer)
While markets recorded moderate increases during the last week, we believe the markets has to drop more to accurately reflect the impact of Covid-19 on the US economy, its companies and its people. Below an extract of an article we wrote yesterday regarding the recent declines in the markets.
- Nasdaq: 3.73%
- S&P 500: 1.86%
- Dow Jones: 1.04%
While markets recorded moderate increases during the last week, we believe the markets has to drop more to accurately reflect the impact of Covid-19 on the US economy, its companies and its people. Below an extract of an article we wrote yesterday regarding the recent declines in the markets.
So lets take a look at some of the major market events during the last week
19 June 2020: The Dow Jones ended the day down by -0.8%
(9:29 ET) The Dow Jones Industrial Average futures are currently trading up by 1.7% just before the open of the trading day
(7:30 ET) The Dow Jones Industrial Average futures are currently trading up by 0.89% two hours before the open of the trading day
(2:18 ET) The Dow Jones Industrial Average futures are currently trading up by 0.79% following two days of modest declines
18 June 2020: The Dow Jones ended the day down -0.15%
(9:36 ET) The Dow opened lower and is currently trading at -0.94% in the red
(06:55 ET) -Dow Futures are currently down by about 0.15% showing the Dow should open up slightly lower today.
17 June 2020: The Dow Jones Industrial Average (DJIA) ended the day, 17 June 2020 down by -0.65%
(13:10 ET) - And back up we go again, as the FED Chair speaks via live webcasts the Dow has entered positive territory again and us now up 0.2%
(10:34 ET) -The DJIA is currently down by -0.4% for the day after opening modestly in the green at the start of the trading day.
(9:30 ET) -Dow Futures are currently up about 0.2% showing the Dow should open up slightly higher today.
Earlier today we looked at Target Corporation in more detail Below a short extract of that article showing a few quick facts about TGT
Read the full More About Target Corporation (TGT) here
16 June 2020: The Dow Jones Industrial Average (DJIA) is up strongly so far today, with it being up 2.6% at the time of writing (12:54 ET)
A stock to watch today and coming days is Tesla (TLSA) with the stock edging ever closer to the $1000 a stock mark. Will it get there?
Moving to the airline industry we take a look at three of the biggest airlines in the US and their stock performance over the last 3 years. The image below shows the stock price performance of United Airlines (UAL), American Airlines (AAL) and Southwest Airlines (LUV) over the last 3 years. The stock of United Airlines declined by -46.16% over the last 3 years, while the stock of Southwest declined by -41.29% and American Airlines declined by a significant -66.24% over the three year period.
(9:29 ET) The Dow Jones Industrial Average futures are currently trading up by 1.7% just before the open of the trading day
(7:30 ET) The Dow Jones Industrial Average futures are currently trading up by 0.89% two hours before the open of the trading day
(2:18 ET) The Dow Jones Industrial Average futures are currently trading up by 0.79% following two days of modest declines
18 June 2020: The Dow Jones ended the day down -0.15%
(9:36 ET) The Dow opened lower and is currently trading at -0.94% in the red
(06:55 ET) -Dow Futures are currently down by about 0.15% showing the Dow should open up slightly lower today.
17 June 2020: The Dow Jones Industrial Average (DJIA) ended the day, 17 June 2020 down by -0.65%
(13:10 ET) - And back up we go again, as the FED Chair speaks via live webcasts the Dow has entered positive territory again and us now up 0.2%
(10:34 ET) -The DJIA is currently down by -0.4% for the day after opening modestly in the green at the start of the trading day.
(9:30 ET) -Dow Futures are currently up about 0.2% showing the Dow should open up slightly higher today.
Earlier today we looked at Target Corporation in more detail Below a short extract of that article showing a few quick facts about TGT
- Target Corporation is listed on the New York Stock Exchange under share code ticker: TGT
- Target Corporation (TGT) market capital: $59.6 billion (as at 17 June 2020)
- Total number of Target outlets: 1,868
- Square footage of all Target outlets: 240 516 000
- Total revenues for Target Corporation during 2019: $78.11 billion
- Total profits for Target Corporation during 2019: $3.281 billion
- Earnings per TGT share in 2019: $6.42
- Dividend per TGT share in 2019: $2.42
- Number of Target Corporation shares outstanding: 515.6 million
- Cash on balance sheet: $2.577 billion
- Stockholders equity: $11.833 billion
- Stockholders equity per share in Target Corporation: $22.94
Read the full More About Target Corporation (TGT) here
16 June 2020: The Dow Jones Industrial Average (DJIA) is up strongly so far today, with it being up 2.6% at the time of writing (12:54 ET)
A stock to watch today and coming days is Tesla (TLSA) with the stock edging ever closer to the $1000 a stock mark. Will it get there?
Moving to the airline industry we take a look at three of the biggest airlines in the US and their stock performance over the last 3 years. The image below shows the stock price performance of United Airlines (UAL), American Airlines (AAL) and Southwest Airlines (LUV) over the last 3 years. The stock of United Airlines declined by -46.16% over the last 3 years, while the stock of Southwest declined by -41.29% and American Airlines declined by a significant -66.24% over the three year period.
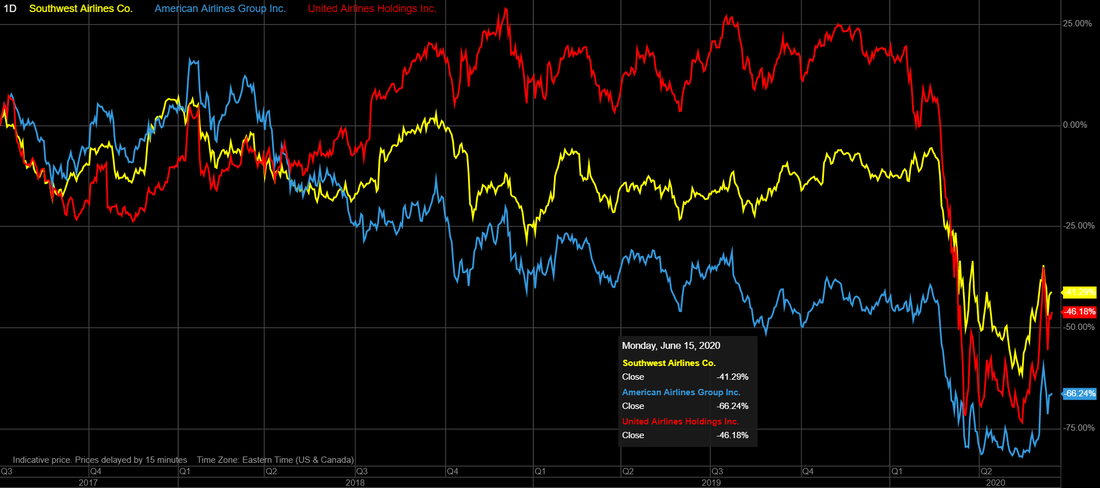
Southwest Airlines (LUV) vs American Airlines (AAL) vs United Airlines (AUL)
Chart of the Dow Jones Industrial Average (DJIA) vs Nasdaq vs S&P500 over last 10 years
The graphic below shows the performance of the Dow Jones Industrial Average (DJIA) index over the last month. As soon as a user clicks on the Nasdaq or S&P500 the graphic recalculates and shows the returns of the additional indices selected. The graphic will recalculate the returns if users provide their own dates, within the last 10 year (or they can select predefined dates from our Zoom box in the graphic). Data for the graphic obtained from MacroTrends.Net
Below the returns of the main market indices over the last 12 months (sorted from best performer to worst performer)
So from the above its is clear that the Nasdaq has easily outperformed other major indices such as the S&P 500 and The Dow Jones over the last 12 months. The same can be said about the 2 year performance, 3 year performance, 5 year performance and 10 year performance, as tech giants listed on the Nasdaq has been driving the performance of the Nasdaq.
- Nasdaq: 24.23%
- S&P 500: 5.3%
- Dow Jones (DJIA): -2.74%
So from the above its is clear that the Nasdaq has easily outperformed other major indices such as the S&P 500 and The Dow Jones over the last 12 months. The same can be said about the 2 year performance, 3 year performance, 5 year performance and 10 year performance, as tech giants listed on the Nasdaq has been driving the performance of the Nasdaq.