
|
Related Topics
|
|
Category: Dow Jones, Nasdaq and S&P 500
Date: 5 September 2020 We take a look at the performance of the Dow Jones, Nasdaq and S&P 500 for the week ending 4 September 2020. The week saw trader and speculator favourite, Tesla (TSLA) take a significant knock as profit taking took place after its significant stock price surge in recent weeks and months.
|

|
We have been calling for a market correction for a while. And we are hoping that the negative trading week is the start of a market correction. We define a market correction as a decline of more than -10%."
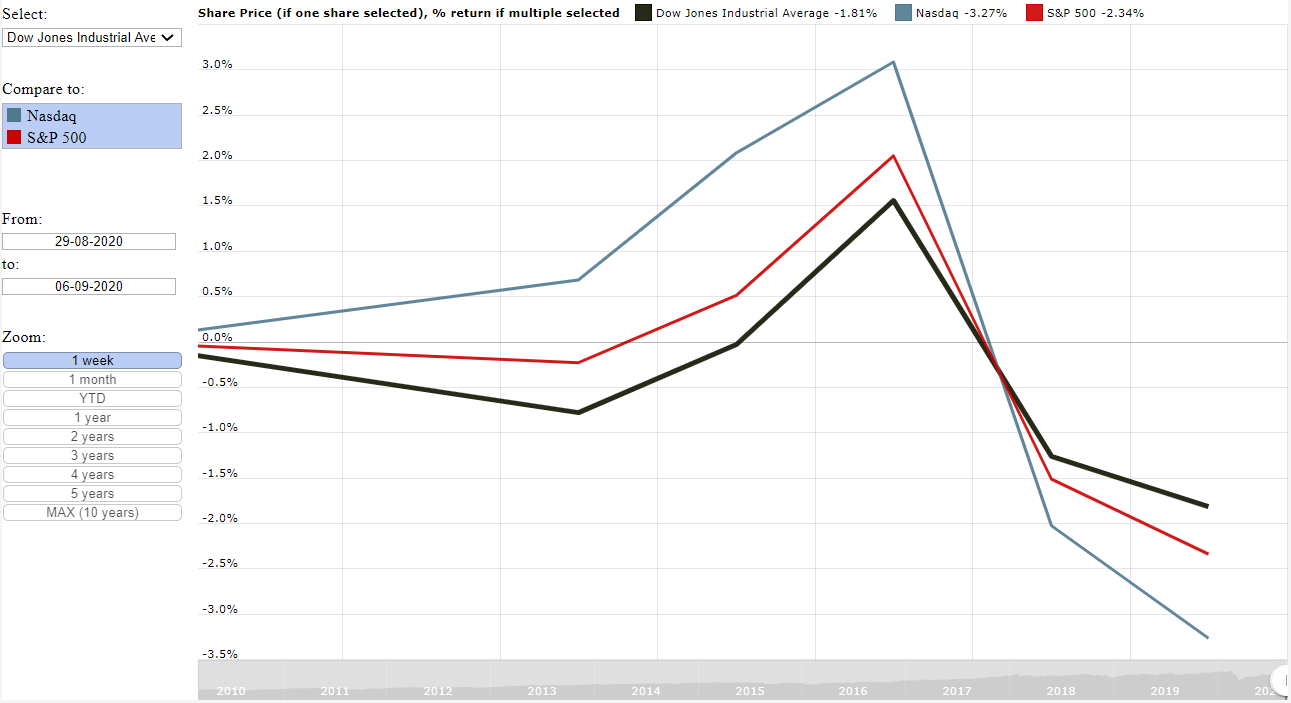
Dow Jones, Nasdaq and S&P 500 recorded a modestly down week (31 August to 4 September)
The image below shows the returns of the Dow Jones (DJIA), Nasdaq and S&P 500 over the last week (31 August 2020 to 4 September 2020). While the week started off on a positive note, it saw a significantly sell off on Thursday and the decline continued on Friday.
Graph of the Dow Jones, Nasdaq and S&P 500 performance for the week ending 7 August 2020
In our recent studies and other week ending performance articles the Nasdaq and S&P 500 tended to outperform the Dow Jones and the S&P 500. However for the week ending 4 September 2020 the Dow was the best performer while the Nasdaq was the worst performer.
Below the returns of the main market indices over the last week, 31 August 2020 to 4 September 2020 (sorted from best performer to worst performer)
We have been calling for a market correction for a while. And we are hoping that the negative trading week is the start of a market correction. We define a market correction as a decline of more than -10%. Market corrections is a healthy part of market behaviour and it helps in shaking out speculators out of the market as they tend to sell positions as soon as they smell trouble. So corrections remove speculators from the market and gets rid of stock bubbles.
Below the returns of the main market indices over the last week, 31 August 2020 to 4 September 2020 (sorted from best performer to worst performer)
- Dow Jones:-1.81%
- S&P 500: -2.34%
- Nasdaq: -3.27%
We have been calling for a market correction for a while. And we are hoping that the negative trading week is the start of a market correction. We define a market correction as a decline of more than -10%. Market corrections is a healthy part of market behaviour and it helps in shaking out speculators out of the market as they tend to sell positions as soon as they smell trouble. So corrections remove speculators from the market and gets rid of stock bubbles.
So lets take a look at some of the major market events during the last week
4 September 2020: The Dow ended the day down by -0.56%
Dow Jones Updates:
(8:36 ET): Dow Jones futures are currently trading up by 0.18%
(4:41 ET): Dow Jones futures are currently trading up by 0.51%
Website Updates:
We covered the latest press release by GrubHub and Just Eat Takeaway.com regarding the merger of the two firms and regulatory approval being granted. Below a short extract:
Just Eat Takeaway.com and Grubhub announced that the Committee on Foreign Investment in the United States ("CFIUS") has concluded its review of the Transaction under Section 721 of the Defense Production Act of 1950 and has determined that there are no unresolved national security concerns with respect to the Transaction. As previously disclosed on 2 July 2020, the United Kingdom Competition and Markets Authority (the "CMA") indicated in a response to a briefing paper submitted by Just Eat Takeaway.com in relation to the Transaction that it had no further questions, and on 7 July 2020, the U.S. Federal Trade Commission granted early termination of the waiting period under the Hart-Scott-Rodino Antitrust Improvements Act of 1976, as amended, with respect to the Transaction. Therefore, all regulatory approvals required for the completion of the Transaction have now been obtained.
Additionally, on 4 September 2020, Just Eat Takeaway.com and Grubhub announced the entry into an amendment to the Merger Agreement to extend the long stop date under the Merger Agreement from 10 June 2021 to 31 December 2021. The amendment provides additional certainty for the parties regarding the timing of the necessary steps to completion, including the registration of Just Eat Takeaway.com ordinary and American depositary shares in the U.S. under the Securities Act of 1933.
Read the full article here
3 September 2020: The Dow ended the day down by -2.78%
Dow Jones Updates:
(15:15 ET): All three major US market indices sink significantly. The S&P 500 is currently down by -4.1%, The Dow Jones is down by -3.2% and the Nasdaq is the worst performer with it being down by -5.45%
(15:06 ET): The Dow Jones is currently trading down by a very strong -3.23% and we cannot say that we are surprised. We have stated on multiple occasions we believe that the markets are heavily overvalued and a strong pull back is required for the longer term health of the markets, as pull backs rids the market of speculators and risk takers
Website Updates:
Earlier today we covered what we believe to 5 heavily overvalued stocks.
They are Tesla, Apple, Amazon, Domino's Pizza and Boston Beer Company
Read the full article here
2 September 2020: The Dow ended the day up by 1.59%
Dow Jones Updates:
(8:07 ET): Dow futures are currently trading up by 0.52%
Website Updates:
We covered the latest earnings report by At Home (HOME). Below a short extract from that article
So what do we value At Home (HOME) stock at following their 2nd quarter 2021 earnings release? Based on their latest earnings report our stock valuation models place a target price (full value price) on At Home Group of $17.70. So we do believe the stock is overvalued at its current price
We usually recommend that long term and fundamental investors look to enter a stock at least 10% below our target price. So a good entry point into the stock of At Home (HOME) would therefore be at $15.90 or below
We expect the stock to pull back from its current levels in coming weeks and months, especially considering the strong run it had recently. We therefore rate their stock as a sell.
Read the full article here.
1 September: The Dow ended the day up by 0.76%
Dow Jones Updates:
(13: 00 ET): The Dow is currently trading up by 0.25%
(02:00 ET): Dow Jones futures are currently trading up slightly by 0.08%
Website Updates:
Below reasons why we believe the stock of Tesla is overvalued.
Well let's start with its Price to Earnings Ratio (PE)
Earnings per share for 2nd quarter 2020: $0.50
Next lets take a look at Tesla's Price/Stockholders equity per share ratio
Stockholders equity in Tesla: $9.855 billion
Lets take a look at the production numbers of Tesla:
Model description June 2020 June 2019 Year on year percentage change
So total production numbers declined by -5% compared to the same quarter of the previous year, yet the group's stock price surges to new all time highs?
Come on people. Surely after reading this you will realise that Tesla (TSLA) stock is one big fat bubble that has sucked in a lot of investors all hoping to get rich from the continuing surge in its stock price. These type of people are created by excess cash in markets. And some of the Covid-19 stimulus cheques have found their way into the stock market and definitely into Tesla's stock and has driven up the stock price of Tesla to levels it should definitely not be at
If you currently own Tesla our advice is to get out while you can and take your profits (if you made some). And if you are planning in buying Tesla now, our advice is to rather not. We rate the stock of Tesla (TSLA) as a SELL
Read the full article here
31 August 2020: The Dow Jones ended the last trading day of August down -0.78%
Dow Jones Updates:
(7:52 ET): Dow Jones futures are currently trading down by 0.21%
Website Updates:
We compared the stock of BJ's Wholesale Club to that of Big Lots in order to determine which one is best placed to provide investors with superior returns over the next couple of years. Below a short extract of the article.
So let's take a look at the fundamentals and the valuation metrics in order to determine which of these two firms offers the most value at their current stock price.
One of our key metrics is the Price to Stockholders equity per share ratio. When looking at this we find the following:
Most firms tend to trade at a ratio of between 2 and 4 times its stockholders equity per share. The higher this ratio the less value a stock offers, and the lower this value the more value a stock offers. At a ratio of 1.51 for Big Lots is actually pretty low. However a stockholders deficit shows that a company's assets is less than its liabilities. And this is the case for BJ's Wholesale Club. So if they sell all their assets they wont be able to pay all their liabilities. So if they are liquidated debt holders will get any cash left and stockholders will get nothing
Next up cash as percentage of stock price:
Next up lets take a look at the percentage cash on the balance sheet makes up of each group's total assets:
Next up the PE ratio of the stock price:
Price relative to our valuation:
So BJ's Wholesale Club has a stockholders deficit, and Big Lots has a relatively low price/stockholders equity per share ratio. BJ's Wholesale is trading a higher PE ratio than Big Lots. For the cash as percentage of total assets Big Lots (BIG) cash makes up a far greater portion of their total assets than that of BJ's Wholesale Club. BJ's Wholesale Club is trading at a premium to our stock price valuation while Big Lots is trading at a discount to our latest valuation of the group.. Based on current stock prices, BJ's Wholesale is overvalued by almost 8% while Big Lots is undervalued by 13.1%.
Based on all the above if we have to buy one of these two retail giants we rate the stock of Big Lots (BIG) hands down as the WINNER in the battle between BJ's Wholesale stock vs Big Lots.
Read the full article
Dow Jones Updates:
(8:36 ET): Dow Jones futures are currently trading up by 0.18%
(4:41 ET): Dow Jones futures are currently trading up by 0.51%
Website Updates:
We covered the latest press release by GrubHub and Just Eat Takeaway.com regarding the merger of the two firms and regulatory approval being granted. Below a short extract:
Just Eat Takeaway.com and Grubhub announced that the Committee on Foreign Investment in the United States ("CFIUS") has concluded its review of the Transaction under Section 721 of the Defense Production Act of 1950 and has determined that there are no unresolved national security concerns with respect to the Transaction. As previously disclosed on 2 July 2020, the United Kingdom Competition and Markets Authority (the "CMA") indicated in a response to a briefing paper submitted by Just Eat Takeaway.com in relation to the Transaction that it had no further questions, and on 7 July 2020, the U.S. Federal Trade Commission granted early termination of the waiting period under the Hart-Scott-Rodino Antitrust Improvements Act of 1976, as amended, with respect to the Transaction. Therefore, all regulatory approvals required for the completion of the Transaction have now been obtained.
Additionally, on 4 September 2020, Just Eat Takeaway.com and Grubhub announced the entry into an amendment to the Merger Agreement to extend the long stop date under the Merger Agreement from 10 June 2021 to 31 December 2021. The amendment provides additional certainty for the parties regarding the timing of the necessary steps to completion, including the registration of Just Eat Takeaway.com ordinary and American depositary shares in the U.S. under the Securities Act of 1933.
Read the full article here
3 September 2020: The Dow ended the day down by -2.78%
Dow Jones Updates:
(15:15 ET): All three major US market indices sink significantly. The S&P 500 is currently down by -4.1%, The Dow Jones is down by -3.2% and the Nasdaq is the worst performer with it being down by -5.45%
(15:06 ET): The Dow Jones is currently trading down by a very strong -3.23% and we cannot say that we are surprised. We have stated on multiple occasions we believe that the markets are heavily overvalued and a strong pull back is required for the longer term health of the markets, as pull backs rids the market of speculators and risk takers
Website Updates:
Earlier today we covered what we believe to 5 heavily overvalued stocks.
They are Tesla, Apple, Amazon, Domino's Pizza and Boston Beer Company
Read the full article here
2 September 2020: The Dow ended the day up by 1.59%
Dow Jones Updates:
(8:07 ET): Dow futures are currently trading up by 0.52%
Website Updates:
We covered the latest earnings report by At Home (HOME). Below a short extract from that article
So what do we value At Home (HOME) stock at following their 2nd quarter 2021 earnings release? Based on their latest earnings report our stock valuation models place a target price (full value price) on At Home Group of $17.70. So we do believe the stock is overvalued at its current price
We usually recommend that long term and fundamental investors look to enter a stock at least 10% below our target price. So a good entry point into the stock of At Home (HOME) would therefore be at $15.90 or below
We expect the stock to pull back from its current levels in coming weeks and months, especially considering the strong run it had recently. We therefore rate their stock as a sell.
Read the full article here.
1 September: The Dow ended the day up by 0.76%
Dow Jones Updates:
(13: 00 ET): The Dow is currently trading up by 0.25%
(02:00 ET): Dow Jones futures are currently trading up slightly by 0.08%
Website Updates:
Below reasons why we believe the stock of Tesla is overvalued.
Well let's start with its Price to Earnings Ratio (PE)
Earnings per share for 2nd quarter 2020: $0.50
- PE ratio of Tesla: 1000
- What this is saying you are paying $1000 for every $1 profit Tesla makes. So if you buying Tesla at $2000 a stock. Just know for a full year the firm is likely to make $2 a stock in profits. So do you honestly believe Tesla is still a good investment? Or that that type of return is a good investment?
Next lets take a look at Tesla's Price/Stockholders equity per share ratio
Stockholders equity in Tesla: $9.855 billion
- Stockholders equity per share in Tesla: $47.60 ($9.52 after the 5 to 1 stock split)
- Tesla is trading at 52.3 times its stockholders equity per share, which is well outside the expected range of between 2 and 4 times that most firms tend to trade at.
- If Tesla were to sell all their assets, settle all their liabilities and distribute what is left equally amongst its stockholders each stockholder will receive $9.52 a stock. So does the $498.32 stock price still look like a good investment?
Lets take a look at the production numbers of Tesla:
Model description June 2020 June 2019 Year on year percentage change
- Model S/X 6 326 14 517 - 56%
- Model 3/Y 75 946 72 531 5%
- Total 82 272 87 048 -5%
So total production numbers declined by -5% compared to the same quarter of the previous year, yet the group's stock price surges to new all time highs?
Come on people. Surely after reading this you will realise that Tesla (TSLA) stock is one big fat bubble that has sucked in a lot of investors all hoping to get rich from the continuing surge in its stock price. These type of people are created by excess cash in markets. And some of the Covid-19 stimulus cheques have found their way into the stock market and definitely into Tesla's stock and has driven up the stock price of Tesla to levels it should definitely not be at
If you currently own Tesla our advice is to get out while you can and take your profits (if you made some). And if you are planning in buying Tesla now, our advice is to rather not. We rate the stock of Tesla (TSLA) as a SELL
Read the full article here
31 August 2020: The Dow Jones ended the last trading day of August down -0.78%
Dow Jones Updates:
(7:52 ET): Dow Jones futures are currently trading down by 0.21%
Website Updates:
We compared the stock of BJ's Wholesale Club to that of Big Lots in order to determine which one is best placed to provide investors with superior returns over the next couple of years. Below a short extract of the article.
So let's take a look at the fundamentals and the valuation metrics in order to determine which of these two firms offers the most value at their current stock price.
One of our key metrics is the Price to Stockholders equity per share ratio. When looking at this we find the following:
- Price/Stockholders equity per share for BJ's Wholesale Club (BJ): Stockholders deficit so this ratio cannot be calculated
- Price/Stockholders equity per share for Big Lots (BIG): 1.51
Most firms tend to trade at a ratio of between 2 and 4 times its stockholders equity per share. The higher this ratio the less value a stock offers, and the lower this value the more value a stock offers. At a ratio of 1.51 for Big Lots is actually pretty low. However a stockholders deficit shows that a company's assets is less than its liabilities. And this is the case for BJ's Wholesale Club. So if they sell all their assets they wont be able to pay all their liabilities. So if they are liquidated debt holders will get any cash left and stockholders will get nothing
Next up cash as percentage of stock price:
- Cash as percentage of stock price for BJ's Wholesale Club (BJ): 2.6%
- Cash as percentage of stock price for Big Lots (BIG): 44.9%
Next up lets take a look at the percentage cash on the balance sheet makes up of each group's total assets:
- Cash as percentage of stock price for BJ's Wholesale Club (BJ): 3.2%
- Cash as percentage of stock price for Big Lots (BIG): 21.5%
Next up the PE ratio of the stock price:
- PE ratio of BJ's Wholesale Club (BJ): 15.8
- PE ratio for Big Lots (BIG) : 7
Price relative to our valuation:
- BJ's Wholesale Club (BJ): 7.8% overvalued based on our latest stock valuation
- Big Lots (BIG): 13.1% undervalued based on our latest stock valuation
So BJ's Wholesale Club has a stockholders deficit, and Big Lots has a relatively low price/stockholders equity per share ratio. BJ's Wholesale is trading a higher PE ratio than Big Lots. For the cash as percentage of total assets Big Lots (BIG) cash makes up a far greater portion of their total assets than that of BJ's Wholesale Club. BJ's Wholesale Club is trading at a premium to our stock price valuation while Big Lots is trading at a discount to our latest valuation of the group.. Based on current stock prices, BJ's Wholesale is overvalued by almost 8% while Big Lots is undervalued by 13.1%.
Based on all the above if we have to buy one of these two retail giants we rate the stock of Big Lots (BIG) hands down as the WINNER in the battle between BJ's Wholesale stock vs Big Lots.
Read the full article
Chart of the Dow Jones Industrial Average (DJIA) vs Nasdaq vs S&P500 over last 10 years
The graphic below shows the performance of the Dow Jones Industrial Average (DJIA) index over the last month. As soon as a user clicks on the Nasdaq or S&P500 the graphic recalculates and shows the returns of the additional indices selected. The graphic will recalculate the returns if users provide their own dates, within the last 10 year (or they can select predefined dates from our Zoom box in the graphic). Data for the graphic obtained from MacroTrends.Net
Below the returns of the main market indices over the last 12 months (sorted from best performer to worst performer)
So from the above its is clear that the Nasdaq has easily outperformed other major indices such as the S&P 500 and The Dow Jones over the last 12 months. The same can be said about the 2 year performance, 3 year performance, 5 year performance and 10 year performance, as tech giants listed on the Nasdaq has been driving the performance of the Nasdaq.
Below a summary of the returns provided by the three major US stock market indices over the last 10 years:
- Nasdaq: 38.4%
- S&P 500: 13.9%
- Dow Jones (DJIA): 3.36%
So from the above its is clear that the Nasdaq has easily outperformed other major indices such as the S&P 500 and The Dow Jones over the last 12 months. The same can be said about the 2 year performance, 3 year performance, 5 year performance and 10 year performance, as tech giants listed on the Nasdaq has been driving the performance of the Nasdaq.
Below a summary of the returns provided by the three major US stock market indices over the last 10 years:
- Nasdaq: 371.8%
- S&P 500: 193%
- Dow Jones (DJIA): 159.1%