
|
Related Topics
|
|
Category: Dow Jones, Nasdaq and S&P 500
Date: 13 April 2020 We take a look at the performance of the three major US market indices for the month of March 2020, during the hart of the Coronavirus (Covid-19) market selloff. Just how has the indices performed during this period and how does that compare to March 2020
|

|
About the Dow Jones Industrial Average (DJIA)
The Dow Jones Industrial Average® (The Dow®), is a price-weighted measure of 30 U.S. blue-chip companies. The index covers all industries except transportation and utilities. The market cap of the Dow Jones firms amounts to $6.523 trillion as at end of March 2020 (down from $7.454 trillion as a tend of February 2020). The Dow Jones Industrial Average has a trailing PE ratio of 19.47 and the PE is projected (forward PE) is at 16.24 with a indicated dividend yield of 2.62% and a price to book value of 3.83.
About the S&P 500
The S&P 500 is widely regarded as the best single gauge of large-cap U.S equities. There is over $9.9 trillion indexed or bench-marked to the index, with the indexed assets comprising approximately $3.4 trillion of this total. The index includes 500 leading companies and covers approximately 80% of the available market capitalization.
Create in 1957, the S&P 500 was the first U.S market-cap-weighted stock market index. Today, it's the basis of many listed and over the counter investment instruments. The world-renowned index includes 500 of the top companies in leading industries of the U.S economy.
To be included in the S&P 500 companies must have an unadjusted market cap of $8.2 billion or greater of which public float mist be at least $4.1 billion. Currently the PE ratio of the S&P 500 is 22.4 (trailing PE) and is projected to be at 17.1. The indicative dividend yield of the S&P 500 is 2.08% with an average price to book value of 3.34
About the Nasdaq
Nasdaq is a global electronic marketplace for buying and selling securities. Nasdaq was created by the National Association of Securities Dealers (NASD) to enable investors to trade securities on a computerized, speedy and transparent system, and commenced operations on February 8, 1971. There are currently more than 4000 companies stock listed on the Nasdaq.
Performance of the Dow Jones against the S&P500 and the Nasdaq during March 2020
The image below shows the returns of the Dow Jones Industrial Average (DJIA), Nasdaq and S&P 500 for the month of March 2020. As the image below shows the overwhelming trend for all three major US indices during the month of March 2020 was overwhelmingly negative.
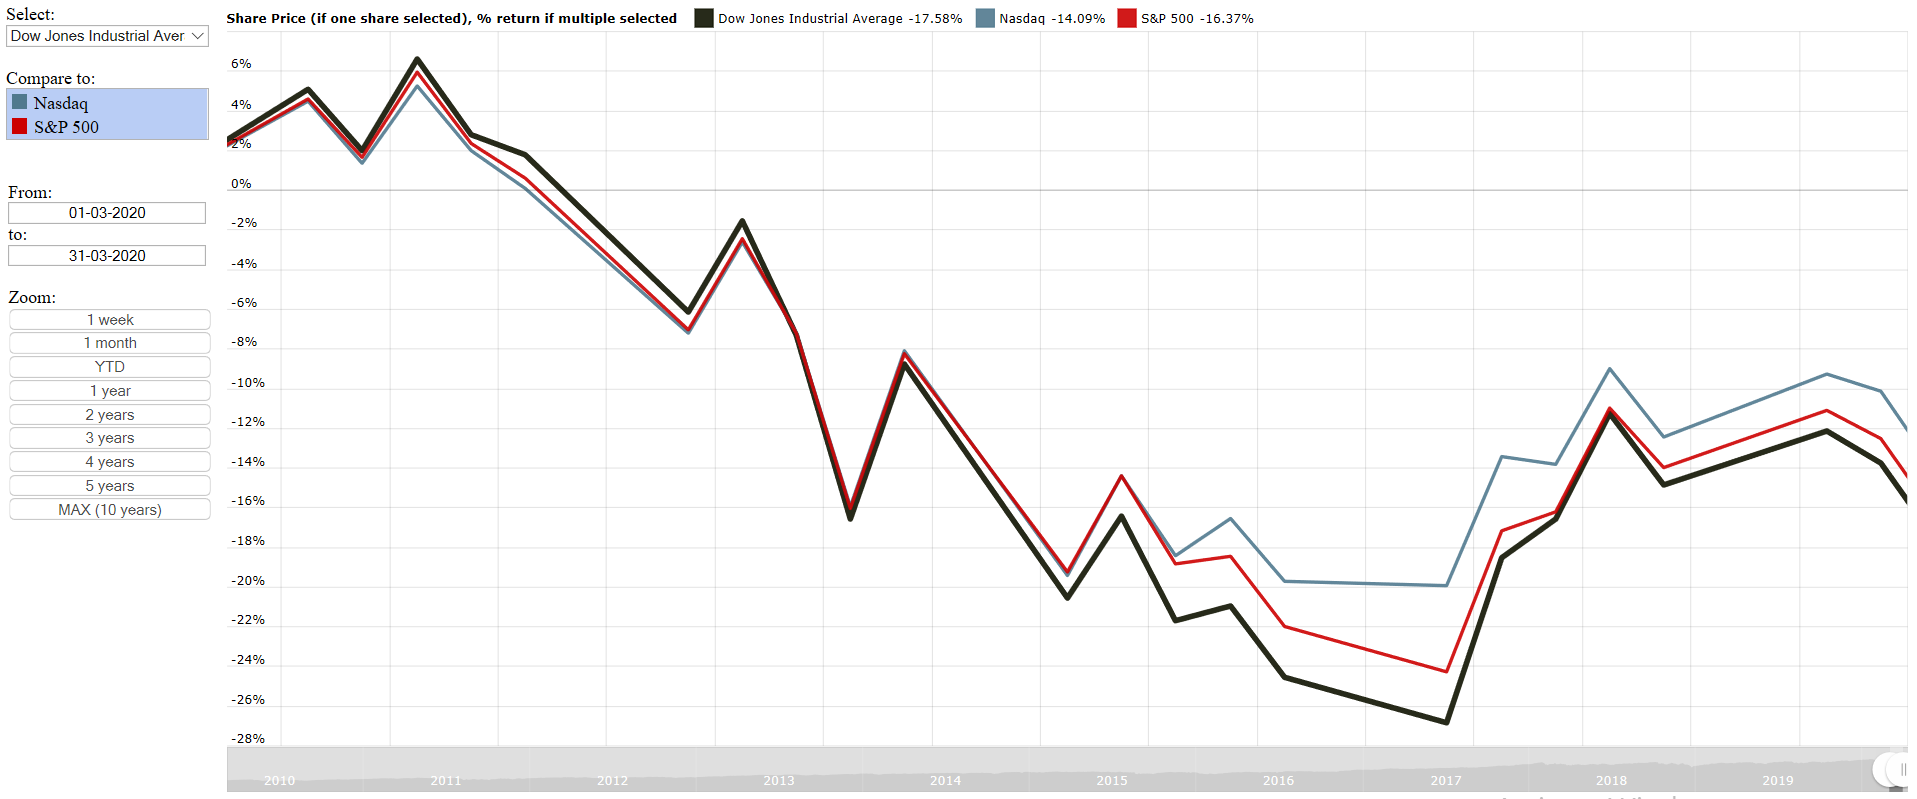
Dow Jones Industrial Average (DJIA) vs Nasdaq vs S&P 500 for March 2020
The summary below shows the performance of the various indices for the month of March 2020 (sorted from best performer to worst performer)
So is it just a matter of the markets performing badly during March months? Or was this horrible performance during the month of March 2020 purely driven by the Coronavirus (Covid-19) impact on world economies, with large parts of the world being under lockdown? Well the performance of the major US market indices were a lot better 12 months ago (for the month of March 2019)
- Nasdaq: -14.09%
- S&P 500: -16.37%
- Dow Jones: -17.58%
So is it just a matter of the markets performing badly during March months? Or was this horrible performance during the month of March 2020 purely driven by the Coronavirus (Covid-19) impact on world economies, with large parts of the world being under lockdown? Well the performance of the major US market indices were a lot better 12 months ago (for the month of March 2019)
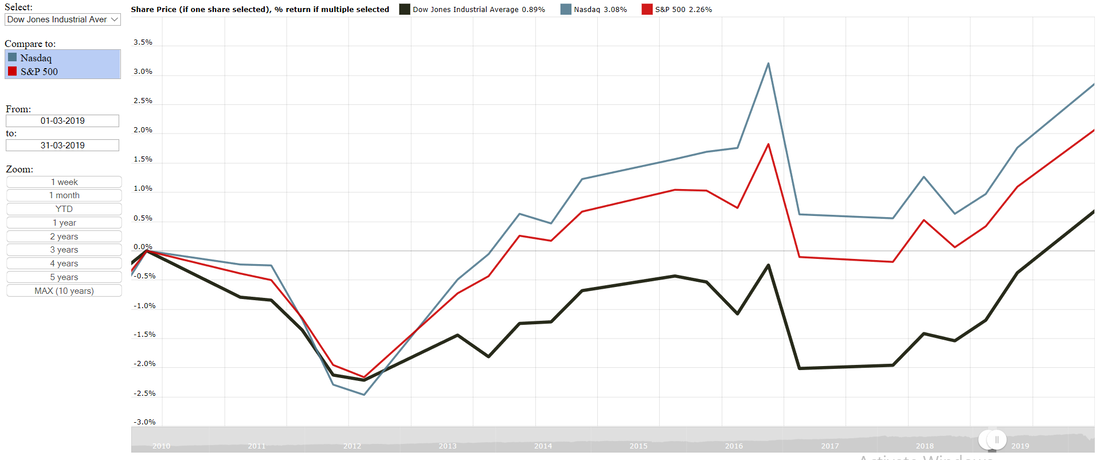
Dow Jones Industrial Average (DJIA) vs Nasdaq vs S&P 500 for March 2019
The summary below shows the performance of the various indices for the month of March 2019 (sorted from best performer to worst performer)
So from the above it is clear that a year ago the major US indices performed a lot better than it did during March this year, which shows that weak market performance is not really related to the month of March, but the significant drop in the markets during March 2020 can be attributed to the impact that Coronavirus has and will have on economies across the world. With large parts of the US, Europe and Asia being under lockdown global economic growth has grinded to a halt.
While economies and people across the world are struggling and suffering, mother nature must be happy as the is being provided with a significant reduction in pollution across the world, which should make a oh so small dent in the trajectory of global working for the coming years. So while there is bad news all around, there is some good news and silver linings around too.
- Nasdaq: 3.08%
- S&P 500: 2.26%
- Dow Jones: 0.89%
So from the above it is clear that a year ago the major US indices performed a lot better than it did during March this year, which shows that weak market performance is not really related to the month of March, but the significant drop in the markets during March 2020 can be attributed to the impact that Coronavirus has and will have on economies across the world. With large parts of the US, Europe and Asia being under lockdown global economic growth has grinded to a halt.
While economies and people across the world are struggling and suffering, mother nature must be happy as the is being provided with a significant reduction in pollution across the world, which should make a oh so small dent in the trajectory of global working for the coming years. So while there is bad news all around, there is some good news and silver linings around too.