
Overview of Lululemon (LULU) earnings release for the 2nd quarter of their 2021 fiscal year
|
Category: Lululemon (LULU)
Date: 9 September 2021 Stock Price of Lululemon: $380.95 Market Capital Of Lululemon: $49.6 billion We take a look at the 2nd quarter earnings for their 2021 fiscal year of Lululemon a sports apparel company. The group reported net revenues of $1.45 billion and net income of $208.1 million for the 2nd quarter of their 2021 fiscal year.
|

|
Our YouTube channel is now live. Watch short summary videos of our articles
- Calvin McDonald, Chief Executive Officer commented: We launched exciting new products, experienced strength across channels and geographies, and announced new partnerships that will allow us to become a leader in product sustainability "
About Lululemon
lululemon athletica inc. (NASDAQ:LULU) is a healthy lifestyle inspired athletic apparel company for yoga, running, training, and most other sweaty pursuits, creating transformational products and experiences which enable people to live a life they love. Setting the bar in technical fabrics and functional designs, lululemon works with yogis and athletes in local communities for continuous research and product feedback. A few quick facts about Lululemon
Read more about Lululemon here
- Lululemon is listed on the Nasdaq under share code ticker: LULU
- Lululemon has 506 company operated retail outlets
- Lululemon employs roughly 19 000 people
Read more about Lululemon here
Lululemon store entrance
Overview of Lululemon's 2nd quarter 2021 earnings report
For the second quarter of 2021, compared to the second quarter of 2020:
- Net revenue increased 61% to $1.5 billion. On a constant dollar basis, net revenue increased 56%.
- Company-operated stores net revenue increased 142% to $695.1 million.
- Direct to consumer net revenue increased 8% to $597.4 million. On a constant dollar basis, direct to consumer net revenue increased 4%.
- Net revenue increased 63% in North America, and increased 49% internationally.
- Direct to consumer net revenue represented 41.2% of total net revenue compared to 61.4% for the second quarter of 2020.
- Gross profit increased 72% to $842.7 million and gross margin increased 390 basis points to 58.1%.
- Income from operations increased 134% to $291.0 million. Adjusted income from operations increased 120% to $299.2 million.
- Operating margin increased 630 basis points to 20.1%. Adjusted operating margin increased 560 basis points to 20.6%.
- Income tax expense increased 123% to $83.1 million. The effective tax rate for the second quarter of 2021 was 28.5% compared to 30.0% for the second quarter of 2020. The adjusted effective tax rate was 27.9% for the second quarter of 2021 compared to 28.9% for the second quarter of 2020.
- Diluted earnings per share were $1.59 compared to $0.66 in the second quarter of 2020. Adjusted diluted earnings per share were $1.65 compared to $0.74 in the second quarter of 2020.
- The Company repurchased 0.5 million shares of its own common stock at an average price of $338.41 per share for a total cost of $171.1 million.
- The Company opened 11 new company-operated stores during the second quarter, ending with 534 stores.
Lululemon's management commentary on their 2nd quarter 2021 earnings report
VANCOUVER, British Columbia--(BUSINESS WIRE)--Sep. 8, 2021-- lululemon athletica inc. (NASDAQ:LULU) today announced financial results for the second quarter of fiscal 2021.
Calvin McDonald, Chief Executive Officer, stated: "Our second quarter results demonstrate the continued momentum across the business, and how we are living into our Power of Three growth plan and Impact Agenda commitments. We launched exciting new products, experienced strength across channels and geographies, and announced new partnerships that will allow us to become a leader in product sustainability." McDonald continued: "I'm inspired every day by our teams around the world for their continued enthusiasm, agility, and commitment to the brand."
Calvin McDonald, Chief Executive Officer, stated: "Our second quarter results demonstrate the continued momentum across the business, and how we are living into our Power of Three growth plan and Impact Agenda commitments. We launched exciting new products, experienced strength across channels and geographies, and announced new partnerships that will allow us to become a leader in product sustainability." McDonald continued: "I'm inspired every day by our teams around the world for their continued enthusiasm, agility, and commitment to the brand."
Meghan Frank, Chief Financial Officer, stated: "Our performance in Q2 was driven by a strong response to our product offering, improving productivity in our stores, and sustained strength in e-commerce. While we continue to navigate the COVID-19 environment, including supply chain headwinds, I'm excited with our momentum as we head into the second half of the year and pleased to be able to increase our guidance. I too would like to thank the teams across the globe for enabling our solid financial performance."
Balance sheet highlights
The Company ended the second quarter of 2021 with $1.2 billion in cash and cash equivalents and the capacity under its committed revolving credit facilities was $397.2 million. Inventories at the end of the second quarter of 2021 increased 17% to $789.8 million compared to $672.8 million at the end of the second quarter of 2020.
2021 Outlook
For the third quarter of 2021, we expect net revenue to be in the range of $1.400 billion to $1.430 billion. Diluted earnings per share are expected to be in the range of $1.28 to $1.33 for the quarter and adjusted diluted earnings per share are expected to be in the range of $1.33 to $1.38.
For 2021, we expect net revenue to be in the range of $6.190 billion to $6.260 billion. Diluted earnings per share are expected to be in the range of $7.16 to $7.26 for the year and adjusted diluted earnings per share are expected to be in the range of $7.38 to $7.48.
Lululemon (LULU) stock price chart over the last 5 years
The image below shows the stock price history of Lululemon for the last 5 years, and its been a very very good time for Lululemon stockholders. 5 years ago the stock was trading at $54.10 and its currently trading at $320. That's a whopping 346.10% return over the last 5 years. No stockholder will ever say no to those kind of returns.
The stock of Lululemon is trading at a lost closer to its 52 week high than it is to its 52 week low which to us is a clear indication that the short term sentiment and momentum of Lululemon stock is very positive at this point in time.
The stock of Lululemon is trading at a lost closer to its 52 week high than it is to its 52 week low which to us is a clear indication that the short term sentiment and momentum of Lululemon stock is very positive at this point in time.

Lululemon (NASDAQ: LULU) stock price history over the last 5 years
Lululemon (LULU) vs Under Armor (UAA) vs Nike (NKE) over the last 5 years
The image below shows the stock price performance of Lululemon (LULU), Under Armour (UAA) and Nike (NKE) over the last 5 years. Over the last 5 years the three stocks provided the following returns:
The stock of Lululemon has easily outperformed that of Nike and Under Armour over the last 5 years.
- Lululemon (LULU): 541.3%
- Nike (NKE): 201.4%
- Under Armour (UAA): -40.8%
The stock of Lululemon has easily outperformed that of Nike and Under Armour over the last 5 years.
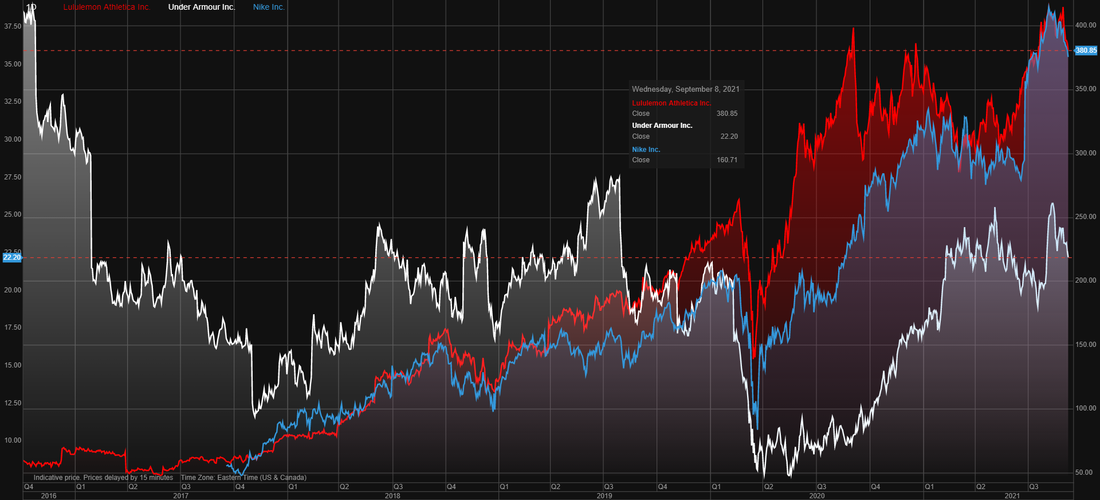
Lululemon (LULU) vs Under Armor (UAA) vs Nike (NKE) over the last 5 years
Lululemon (LULU) latest stock valuation
Based on Lululemon's 2nd quarter 2021 earnings report from Lululemon what do we value their stock at? Based on Lululemon's earnings reported our valuation model provides a target price (full value price) of $192.70 a Lululemon stock (up slightly from our 1st quarter 2020 earnings report valuation of Lululemon).
We therefore believe that the stock of Lululemon is overvalued. We usually recommend that long term fundamental and value investors look to enter a stock at least 10% below our target price which in this case is $192.70. A good entry point into Lululemon would therefore be at $173.40 or below. Since the stock of Lululemon is trading at well above our target price we rate the stock of Lululemon as avoid.
We expect it to pull back strongly from current levels to levels closer to our target price in coming weeks and months.

Lululemon store in a mall
Next earnings release of Lululemon
It is expected that Lululemon will release their 3rd quarter 2021 earnings report in early December 2021