
|
Related Topics
|
|
Category:Netflix (NFLX) and Technical Analysis
Date: 17 July 2020 Stock Price of Netflix : $527 The stock price of Netflix has increased by an astronomical 337% over the last 5 years. An excellent return provided to stockholders. The question is what is next for the stock of Netflix? The stock of Netflix is down significantly in pre-market trade following the release of their 2nd quarter 2020 earnings? Where is it heading over the short and longer term?
|

|
Over the last 5 years the stock of Netflix increased by a whopping 337%. While no stockholder will say no to these types of returns, the question is where to from here for the stock of Netflix?. Below we do some technical analysis on Netflix (NFLX) stock price in order to determine the most likely route NFLX stock is to take in coming weeks and months."
More About NetFlix
Netflix, Inc. (“Netflix”, “the Company”, “we”, or “us”) is the world’s leading subscription streaming entertainment service with over 182 million paid streaming memberships in over 190 countries enjoying TV series, documentaries and feature films across a wide variety of genres and languages. Members can watch as much as they want, anytime, anywhere, on any internet-connected screen. Members can play, pause and resume watching, all without commercials.
Additionally, over two million members in the United States ("U.S.") subscribe to our legacy DVD-by-mail service. We are a pioneer in the delivery of streaming entertainment, launching our streaming service in 2007. Since this launch, we have developed an ecosystem for internet-connected screens and have added increasing amounts of content that enable consumers to enjoy entertainment directly on their internet-connected screens. As a result of these efforts, we have experienced growing consumer acceptance of, and interest in, the delivery of streaming entertainment. Our core strategy is to grow our streaming membership business globally within the parameters of our operating margin target. We are continuously improving our members' experience by expanding our streaming content with a focus on a programming mix of content that delights our members and attracts new members. In addition, we are continuously enhancing our user interface and extending our streaming service to more internet-connected screens. Our members can download a selection of titles for offline viewing.
Additionally, over two million members in the United States ("U.S.") subscribe to our legacy DVD-by-mail service. We are a pioneer in the delivery of streaming entertainment, launching our streaming service in 2007. Since this launch, we have developed an ecosystem for internet-connected screens and have added increasing amounts of content that enable consumers to enjoy entertainment directly on their internet-connected screens. As a result of these efforts, we have experienced growing consumer acceptance of, and interest in, the delivery of streaming entertainment. Our core strategy is to grow our streaming membership business globally within the parameters of our operating margin target. We are continuously improving our members' experience by expanding our streaming content with a focus on a programming mix of content that delights our members and attracts new members. In addition, we are continuously enhancing our user interface and extending our streaming service to more internet-connected screens. Our members can download a selection of titles for offline viewing.

Extraction with Chris Hemsworth is the most watched movie ever on Netflix
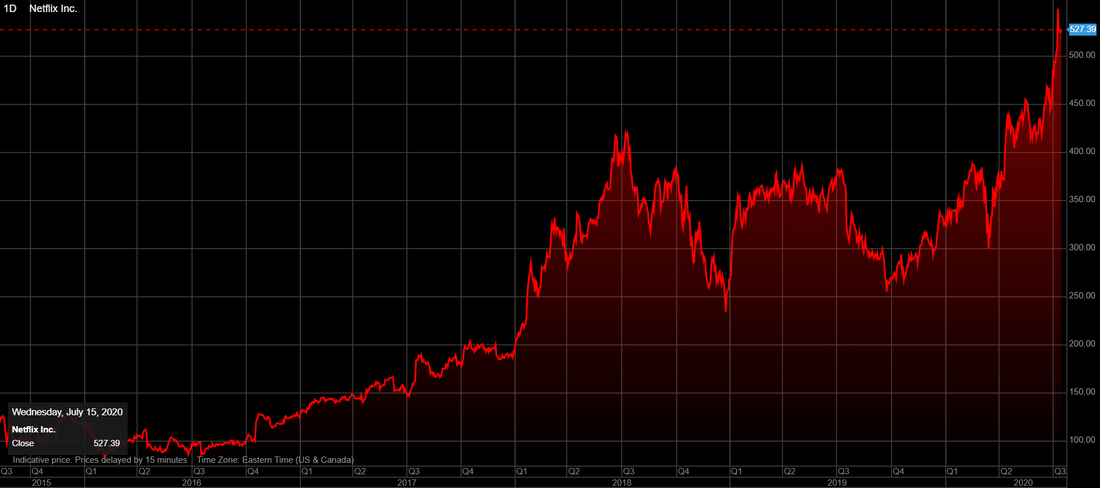
Netflix (NFLX) stock price history over the last 5 years
The image below shows the stock price history of Netflix (NFLX) over the last 5 years. And it's been decent time for Netflix stockholders with the stock of Netflix increasing by 337% over the last 5 years. But as we mentioned in the introduction it is down significantly in pre-market trade, so it might be in for a tough time. So where is the support levels for the stock of Netflix?
Netflix (NFLX) stock price history over the last 5 years
Over the last 5 years the stock of Netflix increased by a whopping 337%. While no stockholder will say no to these types of returns, the question is where to from here for the stock of Netflix?. Below we do some technical analysis on Netflix (NFLX) stock price in order to determine the most likely route NFLX stock is to take in coming weeks and months.
Technical Analysis of Netflix (NFLX) stock price
While there are many different technical analysis indicators we tend to follow the principle of keeping things simple. The KIS principle. So we will take a look at the shorter term moving averages and the longer term moving averages as well as the Relative Strength Index (RSI). So let's focus at the longer term moving averages first.
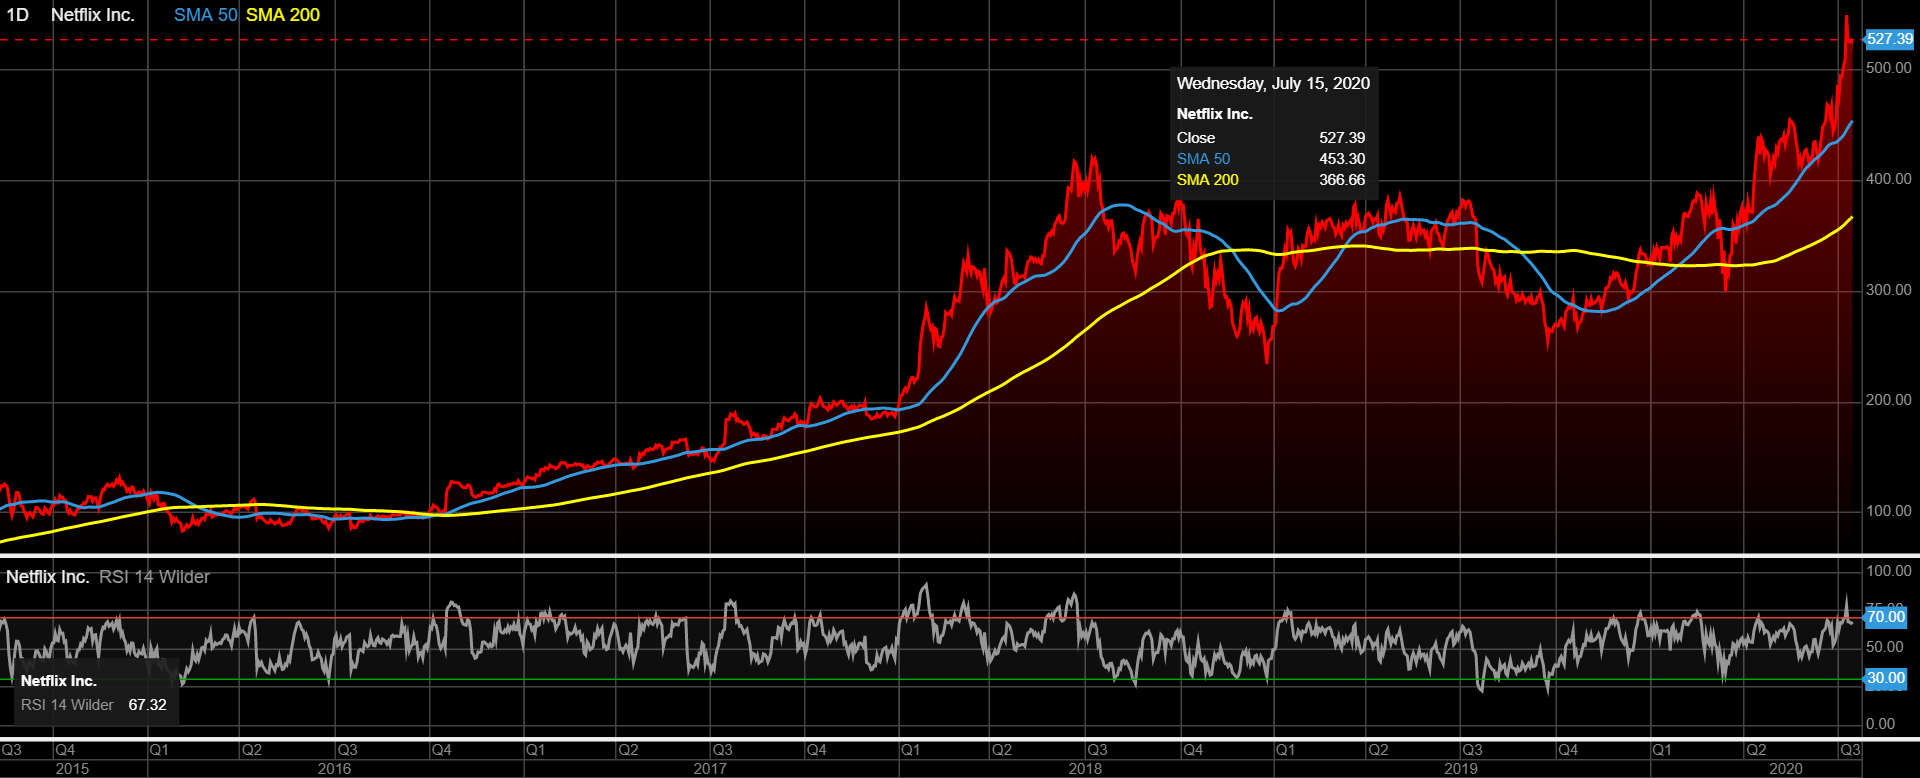
Below we do some technical analysis on Netflix (NFLX) stock price in order to determine the most likely route NFLX stock is to take in coming weeks and months. The image below shows the stock price of Netflix (NFLX) as well as its 50 day and 200 day moving average as well as the RSI.
Below we do some technical analysis on Netflix (NFLX) stock price in order to determine the most likely route NFLX stock is to take in coming weeks and months. The image below shows the stock price of Netflix (NFLX) as well as its 50 day and 200 day moving average as well as the RSI.
The Home Depot (HD) stock price with its 50 and 200 day moving average and RSI
From the image above, one can see that the RSI is just below the 70 mark, which is an indicator of a stock being overbought (basically it is due for a correction). So the RSI has been in the overbought territory for a while and is still close to overbought territory (and with the stock of Netflix being own strongly in pre-market trade it seems the stock is due a correction). So where will it head to and where will the stock find support? Moving averages provides a good answer and we will take a look at these below.
Turning our attention to the moving averages one can see the 50 day moving average is well above the 200 day moving average (which is a positive sign for a company's stock price). If the 50 day moving average crosses below the 200 day moving average it is a negative sign and indicates potential stock declines, if the 50 day crosses above the 200 day moving average its a positive sign for a company's stock price.
From the image above one can see the 50 day moving average is well above the 200 day moving average, which is a positive sign. But since the RSI has been coming down recently and is still around the 70 mark its pointing to a potential decline in the stock of Netflix (NFLX). The question is how far will it fall, if it falls? The 50 day moving average and 200 day moving average also shows medium and long term support levels for a stock price. So should Netflix (NFLX) stock decline more it is expected to find medium and longer term support at the following prices:
As we mentioned 50 day and 200 day moving averages are longer term technical indicators, so let's take a look at shorter term indicators. The image below shows the stock price of Netflix (NFLX) as well as its 10 day and 30 day moving average as well as the RSI.
Turning our attention to the moving averages one can see the 50 day moving average is well above the 200 day moving average (which is a positive sign for a company's stock price). If the 50 day moving average crosses below the 200 day moving average it is a negative sign and indicates potential stock declines, if the 50 day crosses above the 200 day moving average its a positive sign for a company's stock price.
From the image above one can see the 50 day moving average is well above the 200 day moving average, which is a positive sign. But since the RSI has been coming down recently and is still around the 70 mark its pointing to a potential decline in the stock of Netflix (NFLX). The question is how far will it fall, if it falls? The 50 day moving average and 200 day moving average also shows medium and long term support levels for a stock price. So should Netflix (NFLX) stock decline more it is expected to find medium and longer term support at the following prices:
- 50 day moving average: $453.30
- 200 day moving average : $366.66
As we mentioned 50 day and 200 day moving averages are longer term technical indicators, so let's take a look at shorter term indicators. The image below shows the stock price of Netflix (NFLX) as well as its 10 day and 30 day moving average as well as the RSI.

The Home Depot (HD) stock price with its 10 and 30 day moving average and RSI
In a similar vein to the approach to the longer term analysis, if the 10 day moving averages crosses over above the 30 day moving average it is a positive sign for a stock and if the 10 day moving average crosses below the 30 day moving average its a negative sign for a stock price. At this point the 10 day moving average is trading at very close to the 30 day moving average (a positive sign as it recently broke above the 30 day moving average). But since the RSI is indicating potential future declines the question is over the shorter term period where are the support levels for Netflix stock price?
So should Netflix (NFLX) stock be in for a correction the first support levels will be the shorter term levels shown above. If the stock falls below these support levels the next support levels will be the 50 day and 200 day moving average levels.
Thus if the stock of Netflix decides today to start its decline we will see the following levels as support levels for Netflix (NFLX):
While the short term and medium to longer term moving averages for Netflix all point in a positive direction, the fact that the RSI was recently in overbought territory (above 70) and is approaching this level again, which indicates that Netflix (NFLX) is potentially overbought and due a correction. And it seems Netflix's latest earnings report might be the catalyst for their stock price correction.
We do believe the stock is due some weakness until the RSI hits the levels around 30 which would indicate oversold territory and indicate an end to the correction. So for now if the stock of Netflix declines strongly and falls through the 10 and 30 day moving average the next level it would head to is the 50 day moving average and if it falls below that price the stock of Netflix could head all the way down to its 200 day moving average which is currently at $366.66
However we do not believe it will pull back so far in the short term, but we expect the stock of Netflix to fall below its 10 day moving average of $512.42 and will be testing levels closer to its 30 moving average of $466.40
- 10 day moving average: $512.42
- 30 day moving average: $466.40
So should Netflix (NFLX) stock be in for a correction the first support levels will be the shorter term levels shown above. If the stock falls below these support levels the next support levels will be the 50 day and 200 day moving average levels.
Thus if the stock of Netflix decides today to start its decline we will see the following levels as support levels for Netflix (NFLX):
- 10 day moving average: $512.42
- 30 day moving average: $466.40
- 50 day moving average: $453.30
- 200 day moving average : $366.66
While the short term and medium to longer term moving averages for Netflix all point in a positive direction, the fact that the RSI was recently in overbought territory (above 70) and is approaching this level again, which indicates that Netflix (NFLX) is potentially overbought and due a correction. And it seems Netflix's latest earnings report might be the catalyst for their stock price correction.
We do believe the stock is due some weakness until the RSI hits the levels around 30 which would indicate oversold territory and indicate an end to the correction. So for now if the stock of Netflix declines strongly and falls through the 10 and 30 day moving average the next level it would head to is the 50 day moving average and if it falls below that price the stock of Netflix could head all the way down to its 200 day moving average which is currently at $366.66
However we do not believe it will pull back so far in the short term, but we expect the stock of Netflix to fall below its 10 day moving average of $512.42 and will be testing levels closer to its 30 moving average of $466.40