
|
Related Topics
|
|
Category: Stock Market and Netflix
Date: 17 July 2020 Stock Price of Netflix: $527.39 We take a look at the 2nd quarter earnings release of their 2020 fiscal year of Netflix, the world's leading internet entertainment service group with over 192 million paid memberships (up by 10 million subscribers for the latest quarter). The group recorded revenue of $6.148 billion in the 2nd quarter of their 2020 fiscal year.
|
|
We live in uncertain times with restrictions on what we can do socially and many people are turning to entertainment for relaxation, connection, comfort and stimulation. In Q1 and Q2, we saw significant pull-forward of our underlying adoption leading to huge growth in the first half of this year (26 million paid net adds vs. prior year of 12 million)"
About Netflix
Netflix is the world's leading internet entertainment service with over 151 million paid memberships in over 190 countries enjoying TV series, documentaries and feature films across a wide variety of genres and languages. Members can watch as much as they want, anytime, anywhere, on any internet-connected screen. Members can play, pause and resume watching, all without commercials or commitments.
Ten years ago a company like Netflix would have been given a very slim chance of survival. Today its one of the largest companies in the world based on its market capital, and its also part of famed FAANG stocks. FAANG is a acronym for Facebook, Apple, Amazon, Netflix and Google.
Ten years ago a company like Netflix would have been given a very slim chance of survival. Today its one of the largest companies in the world based on its market capital, and its also part of famed FAANG stocks. FAANG is a acronym for Facebook, Apple, Amazon, Netflix and Google.

Extraction. with Chris Hemsworth is officially the most watched movie on Netflix
Overview of Netflix's 2nd quarter 2020 earnings report
The data refers to the latest quarter unless specified otherwise:
Regional information for Netflix
The summary below shows the revenue earned for Netflix from various regions for the 1st quarter of their 2020 fiscal year (in $ thousands)
- Revenue: $5.767 billion (up from $4.520 billion from the same quarter of the previous year)
- Revenue increased by 27.6% over the last 12 months
- Cost of revenue: $3.599 billion (up from $2.870 billion for the same quarter of the previous year)
- Cost of revenue increased by 25.4% over the last 12 months
- Net income $709.067 million (up from $344.052 million for the same quarter of the previous year)
- Diluted earnings per share: $1.57 (up from $0.76 for the same quarter of the previous year)
- PE ratio of Netflix: 68.9
- Diluted weighted-average shares outstanding: 452.494 million (up from 451.922 million for the same quarter of the previous year)
- Cash and cash equivalents: $5.151 billion
- Cash and cash equivalents per share: $11.38
- Cash and cash equivalents makes up 2.6% of Netflix's market capital
- Cash and cash equivalents makes up 14.6% of Netflix's total assets
- Stockholders equity of Netflix: $8.409 billion
- Stockholders equity per share: $18.6
- Netflix is trading at 23.3 times its stockholders equity which is well outside the expected range of between 2 and 4 which most companies tend to trade at.
- For reference the S&P500 is trading at a price to book of 3.34. For more about the S&P500 read here
Regional information for Netflix
The summary below shows the revenue earned for Netflix from various regions for the 1st quarter of their 2020 fiscal year (in $ thousands)
- United States and Canada: $2 702 776
- Europe, Middle East and Africa: $1 723 474
- Latin America: $793 453
- Asia- Pacific: $483 660
Netflix' management commentary on their 2nd quarter 2020 earnings
Fellow shareholders, We live in uncertain times with restrictions on what we can do socially and many people are turning to entertainment for relaxation, connection, comfort and stimulation. In Q1 and Q2, we saw significant pull-forward of our underlying adoption leading to huge growth in the first half of this year (26 million paid net adds vs. prior year of 12 million). As a result, we expect less growth for the second half of 2020 compared to the prior year. As we navigate these turbulent circumstances, we’re focused on our members by continuing to improve the quality of our service and bringing new films and shows to people's screens
Ted Sarandos appointed co-CEO and elected to Board of Directors
Ted joined Netflix over 20 years ago, and we are thrilled to appoint him to be co-CEO with Reed. “Ted has been my partner for decades. This change makes formal what was already informal -- that Ted and I share the leadership of Netflix,” says Hastings. Lead Independent director Jay Hoag says “Having watched Reed and Ted work together for so long, the board and I are confident this is the right step to evolve Netflix’s management structure so that we can continue to best serve our members and shareholders for years to come.”
Q2 Results and Q3 Forecast In Q2
Revenue grew 25% year over year, while quarterly operating income exceeded $1 billion. Average streaming paid memberships in Q2 rose 25% year over year while streaming ARPU increased 0.4% year over year. Excluding a -$289m impact from foreign exchange (F/X), streaming ARPU grew 5% year over year. Operating margin expanded 770 basis points year over year to 22.1%, above our guidance forecast due to higher than expected membership and revenue growth. In addition, content and marketing expenses were lower than we expected, as the pandemic delayed some planned spend. EPS of $1.59 vs. $0.60 a year ago included a $119m non-cash unrealized loss from F/X remeasurement on our Euro denominated debt and a $220m non-cash valuation allowance for deferred tax assets (due to recent legislation limiting the use of California R&D credits). Our Q2 effective tax rate of 30.5% includes about a 21% point negative impact due to the valuation allowance. We added a Q2-record 10.1m paid memberships vs. 2.7m in last year’s Q2. The positive variance relative to our 7.5m forecast was due to better-than-forecast acquisition and retention. In the first half of this year, we’ve added 26m paid memberships, nearly on par with the 28m we achieved in all of 2019. However, as we expected (and can be seen in the graph below), growth is slowing as consumers get through the initial shock of Covid and social restrictions. Our paid net additions for the month of June also included the subscriptions we cancelled for the small percentage of members who had not used the service recently.
As a reminder, more than half of our revenue is not denominated in US dollars and we don’t hedge our foreign exchange exposure. If the US dollar remains at these elevated levels (or strengthens further), we may target modestly slower growth in our annual operating margin progression next year. Given that lead time, we believe we can readjust our model to be appropriate in that new stronger US dollar world.

Netflix weekly net paid additions to subscriber numbers
Content
As the world slowly re-opens, our main business priority is to restart our productions safely and in a manner consistent with local health and safety standards to ensure that our members can enjoy a diverse range of high quality new content. Given the significant differences between countries (e.g., incidence of new Covid-19 cases, availability of testing, government and industry regulations), there is no one-size-fits-all approach, and we’re adapting to local circumstances. Today, we’re slowly resuming productions in many parts of the world. We are furthest along in Asia Pacific (where we never fully shut down in Korea, for example) and are now shooting live action series like season 2 of our Japanese original The Naked Director. In EMEA, we are now back in production in many countries, including Germany, France, Spain, Poland, Italy, and the UK. While we recently resumed production on two films in California and two stop-motion animation projects in Oregon and expect some more of our US productions to get going this quarter, current infection trends create more uncertainty for our productions in the US. Parts of the world like India and some of Latin America are also more challenging and we are hoping to restart later in the year in these regions. Since our content production lead time is long, our 2020 plans for launching original shows and films continue to be largely intact.
For 2021, based on our current plan, we expect the paused productions will lead to a more second half weighted content slate in terms of our big titles, although we anticipate the total number of originals for the full year will still be higher than 2020. We’ll also round out our content offering with film acquisitions like The Trial of the Chicago 7 from Aaron Sorkin and The Spongebob Movie: Sponge on the Run (global excluding US and China). We also acquired nearly completed seasons of unreleased original series like Cobra Kai (seasons 1, 2 and a brand new season 3) and Emily in Paris starring Lily Collins. The pandemic and pauses in production are impacting our competitors and suppliers similarly. With our large library of thousands of titles and strong recommendations, we believe our member satisfaction will remain high.
Competition
All of the major entertainment companies like WarnerMedia, Disney and NBCUniversal are pushing their own streaming services and two of the most valuable companies in the world, Apple and Amazon, are growing their investment in premium content. In addition, TikTok’s growth is astounding, showing the fluidity of internet entertainment. Instead of worrying about all these competitors, we continue to stick to our strategy of trying to improve our service and content every quarter faster than our peers. Our continued strong growth is a testament to this approach and the size of the entertainment market.
Cash Flow and Capital Structure
Net cash generated in operating activities in Q2 was +$1 billion vs. -$544 million in the prior year period. Free cash flow was positive for a second consecutive quarter at +$899m vs. -$594 million. Free cash 1 flow was higher than net income due primarily to the loss on FX remeasurement and the valuation allowance for deferred tax assets, both of which were non-cash items that reduced net income. Our FCF profile is continuing to improve, which is being driven in part by our growing operating margin and the digestion of our big move into the production of Netflix originals that requires more cash upfront vs. licensed content. In addition, the pause in production has also pushed out cash spending on content into the second half of 2020 and into 2021. Due to the pause in production from the pandemic combined with higher-than-forecast paid net adds year to date, we now expect free cash flow for the full year 2020 to be breakeven to positive, compared with our prior expectation for -$1 billion or better. As we indicated last quarter, in 2021 we project that full year free cash flow will dip back to being negative again, although we believe the FCF deficit will be materially better than our peak deficit level of -$3.3 billion in 2019. There has been no material change in our overall estimated timetable to reach consistent annual positive FCF within the next few years. We’re often asked by investors what our FCF profile would be at “steady state” or when our cash content spending matches our content amortization.
The pandemic and the resulting pause in productions provides one early snapshot of what that may look like. In Q2’20, our cash spending on content was $2.6 billion, equivalent to our content amortization of $2.6 billion, or a 1x cash content-to-content amortization ratio . This resulted in a FCF margin of +15% in Q2. Of course, our plan 2 is to continue to grow our content spend (as we don’t believe we are anywhere near maturity), but the above analysis may prove illustrative. And by the time our cash content-to-content amortization ratio reaches 1x on a sustained basis (which is still many years away), we hope to have many more members and much greater revenue, operating margin and FCF. In April, we raised $1 billion of debt at a blended rate of ~3.3% across both US dollar and Euro tranches. We ended Q2 with more than $7 billion of cash and cash equivalents on our balance sheet. As part of our commitment to racial equity, we allocated about two percent of our cash holdings - initially up to $100 million - into financial institutions and organizations that directly support Black communities in the US. We hope other US large-caps will also consider taking this small and relatively easy step to bolster US racial economic equity. With our cash balance, $750 million credit facility (which remains undrawn) and improving FCF profile, we have sufficient liquidity to fund our operations for over 12 months. As a result, we don’t expect to access the debt markets for the remainder of 2020 and we believe our need for external financing is diminishing.
Netflix (NASDAQ: NFLX) stock price history
The image below, obtained from Google, shows the stock price history of Netflix (NASDAQ: NFLX) over the last 5 years. And it's been a exceptional time for Netflix (NASDAQ: NFLX). 5 years ago the stock was trading at around $115 and its currently trading at $433.83. That's a excellent return of 363% over the last 5 years.
The stock is however trading at very close to its 52 week high of $575.37 and is far far away from its 52 week low of $252.28, which to us is a clear indication that the short term sentiment and momentum of Netflix is very positive at this point in time. While stock market sentiment has been very negative due to the impact of Covid-19 and the ensuing lockdowns instituted due to it, this has benefitted Netflix greatly as more people stay at home they have seen a sharp increase in their revenues and subscriber numbers.
However looking at the pre-market activity in Netflix stock it looks like market participants did not like their latest results as the stock of Netflix is trading down -7.3% in pre-market trade following the release of NetFlix's latest results

Netflix (NASDAQ: NFLX) stock price history over the last 5 years.
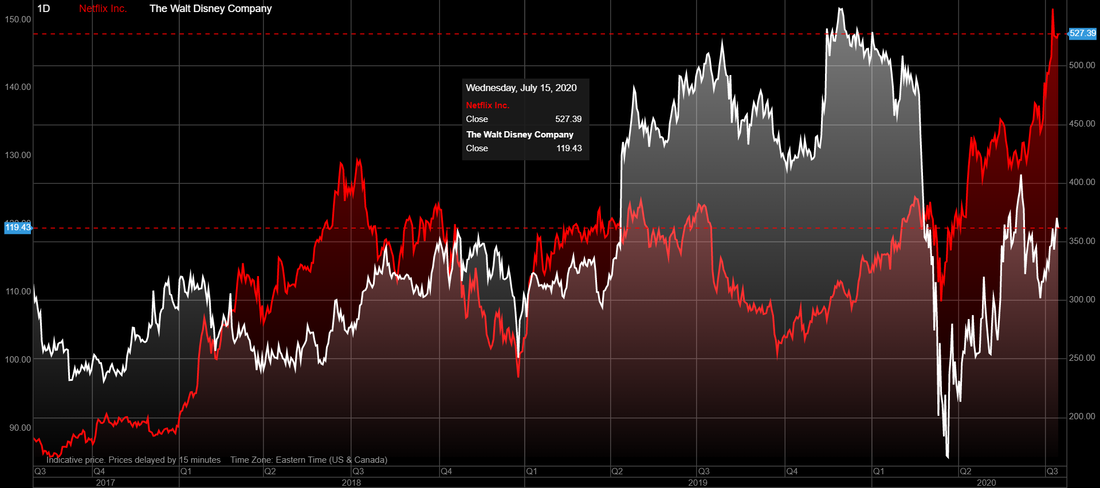
Netflix (NFLX) stock vs Walt Disney (DIS) stock over the last 3 years
The image below shows the stock price performance of Netflix (NFLX) and Walt Disney (DIS) over the last 3 years. While both these firms are active in the consumer entertainment industry and both are active in the video streaming service industry, the stock price performance and trends of these two firms are very different. Over the 3 year period Netflix returned 189.7% while the stock of Disney returned 8% over the same period of time. Netflix being the clear winner when it comes to stock performance over the last 3 years.
Recent coverage of Netflix
Recent coverage of Netflix's latest results as obtained from Fool.com
Netflix Inc. logged another blockbuster quarter Thursday with the addition of 10.1 million new paid subscribers and a significant jump in revenue, and rewarded one of its most important executives with a promotion, but shares declined in after-hours trading on fears of slowing second-half growth.
Netflix NFLX, +0.78% reported 10.1 million new subscribers in the second quarter, topping the 10 million mark for a second consecutive quarter amid shelter-in-place orders related to the COVID-19 pandemic. The company reported net earnings of $720 million, or $1.59 a share, compared with net income of $270.7 million, or 60 cents a share, in the year-ago quarter. Revenue improved to $6.15 billion from $4.92 billion a year ago. Analysts surveyed by FactSet had expected adjusted earnings of $1.82 a share on sales of $6.08 billion.
They also expected the addition of 8.21 million paid subscriptions, higher than Netflix’s forecast of 7.5 million in April. Netflix’s shares have soared 64% this year, while the broader S&P 500 index SPX, -0.34% has declined 0.5% in 2020.
Netflix’s second-quarter results sent shares of the video-streaming giant down more than 8% in after-hours trading Thursday, following a four-month surge that has propelled its stock ($527.39 at the close) and market valuation (more than $230 billion) to record highs. In a letter to shareholders, Netflix executives admitted that the gains in the first half of the year were likely pulled forward from later in the year, which means fewer new subscribers in the rest of 2020.
“In Q1 and Q2, we saw significant pull-forward of our underlying adoption leading to huge growth in the first half of this year (26 million paid net adds vs. prior year of 12 million),” executives said in the letter. “As a result, we expect less growth for the second half of 2020 compared to the prior year.”
Read the full article here
Netflix (NASDAQ: NFLX) latest stock valuation
So based on the earnings report of Netflix (NASDAQ: NFLX) what do we value Netflix (NFLX) stock at? Based on the earnings report and the increased competition our valuation models sets a target (full value) price on Netflix of $386.20. (up strongly from our 1st quarter 2020 Netflix earnings report valuation). Based on our target price (full value price) we believe the stock of Netflix is overvalued.
We usually recommend that long term fundamental or value investors look to enter a stock at least 10% below our target price (full value price) which in this case is $386.20 We therefore believe a good entry point into Netflix is $347.60 or below. Since the stock of Netflix is well above our recommended entry point we would not recommend buying into Netflix right now as we believe there is still a lot of hope and fairytales and butterflies built into their future earnings expectations with the group trading at a PE ratio of over 83.
We therefore rate the stock of Netflix (NFLX) as a SELL
Next earnings release for Netflix
It is expected that Netflix will release its 3rd quarter earnings report for their 2020 fiscal year towards the end of October 2020.