|
Related Topics
|
|
Category: Stock Market and Restoration Hardware
Date: 11 September 2019 Stock Price: $158.88 We take a look at the 2nd quarter earnings release of their 2019 fiscal year of Restoration Hardware the luxury brand home furnishings group.
|
|
About Restoration Hardware
We believe RH is one of the most innovative and fastest growing luxury brands in the home furnishings marketplace. We believe our brand stands alone and is redefining this highly fragmented and growing market, contributing to our superior sales growth and market share gains over the past several years as compared to industry growth rates. Our ability to innovate, curate and integrate products, categories, services and businesses with a completely authentic and distinctive point of view, then rapidly scale them across our fully integrated multi-channel infrastructure is a powerful platform for continued long-term growth. We evolved our brand to become RH, positioning our Company to curate a lifestyle beyond the four walls of the home. Our unique product development, go-to-market and supply chain capabilities, together with our significant scale, enable us to offer a compelling combination of design, quality and value that we believe is unparalleled in the marketplace.
Financial overview of Restoration Hardware's latest earnings report
The numbers we are interested in (for the quarter):
- Net sales $706.514 million (up from $640.798 million from the same quarter of the previous year)
- Cost of sales: $411.556 million (up from $372.454 million for the same quarter of the previous year)
- Net income: $63.757 million (down from $62.906 million for the same quarter of the previous year)
- Diluted earnings per share: $2.86 (up from $2.29 for the same quarter of the previous year)
- PE ratio: 13.62 (based on the earnings per share for the current quarter being reported for full fiscal year)
- Diluted weighted-average shares outstanding: 22.324 million (down from 27.496 million for the same quarter of the previous year)
- Cash and cash equivalents: $11.55 million
- Cash and cash equivalents per share: $0.51
- Cash and cash equivalents makes up 0.32% of Restoration Warehouse's market capital
- Cash and cash equivalents makes up 0.48% of Restoration Warehouse's total assets
- Merchandise inventories: $480.688 million
- Merchandise inventories makes up 20.13% of the group's total assets.
- Cash generated from operations (for six months): $99.479 million
- Cash generated from operations per share (for six months): $4.46
Restoration Hardware's management commentary on the results and earnings guidance
CORTE MADERA, Calif.--(BUSINESS WIRE)--Sep. 10, 2019-- RH (NYSE: RH) today announced second quarter fiscal 2019 results. Chairman & Chief Executive Officer Gary Friedman provided an update on the Company’s continued evolution and outlook.
To Our People, Partners, and Shareholders,
We are pleased to report another quarter of record results, and are raising our fiscal 2019 guidance for the third time this year. We generated record GAAP revenues of $706.5 million, an increase of 10.3%, record GAAP operating margin of 14.7%, record adjusted operating margin of 14.9%, record GAAP earnings per share of $2.86, and record adjusted diluted earnings per share of $3.20, a 59% increase versus $2.01 a year ago applying a 21% normalized tax rate in both years.
Our focus on elevating the brand, architecting an integrated operating platform, and pivoting the Company back to growth has resulted in RH standing out as one of the few brands that is growing revenues, expanding operating margins, and driving significantly higher returns on invested capital and free cash flow. Despite achieving industry leading operating margins, we continue to demonstrate our ability to grow earnings significantly faster than revenues, illustrating the desirability of our differentiated product offering, and the emergence of RH as a luxury brand generating luxury margins.
Second quarter adjusted net revenues increased 9.9% over last year reflecting the strength of our core RH business, the performance of our new galleries, particularly RH New York, the continued expansion of RH Hospitality and planned accelerated outlet sales due to the previously mentioned closure of a 500,000 square foot distribution facility in the fourth quarter of fiscal 2018. Additionally, we experienced better than expected delivered sales in the last few weeks of the quarter as a result of shipping efficiencies and lower returns due to the recent redesign of our home delivery network.
As a reminder, embedded in our 2019 guidance there is an approximate 3 point revenue reduction as a result of editing unprofitable and non-strategic businesses, namely the elimination of the remaining holiday business (1 point), the elimination of fringe promotions (1 point), and the transition of our rug business from a single source importer to a direct sourcing model (1 point). As planned, the drag was approximately 2 points in the first quarter, 4 points in the second quarter and we expect approximately 2 points in the third quarter and 4 points in the fourth quarter. Taking into account the approximate 4 point negative drag, adjusted net revenues would have increased 13.9% in the second quarter. We expect our new rug collection to contribute to both revenue and earnings growth in fiscal 2020.
Despite the increase in tariffs and some negative macro trends, we remain optimistic that our business momentum will continue, supported by a number of positive factors including by the recent mailing of the Fall Interiors and soon to be in-home Modern Source Books, the increasing contribution from RH Beach House, the launch of RH Ski House and new Galleries opening this fall.
Our largest and most important new Gallery, RH New York, continues to trend comfortably in excess of $100 million in annualized revenue for fiscal 2019 and will generate more than $30 million of cash contribution in its first full fiscal year. We are on track to open RH Minneapolis, the Gallery in Edina, RH Columbus, the Gallery at Easton Town Center, and RH Marin, the Gallery at the Village of Corte Madera, in the second half. These new prototype Galleries average 45,000 square feet of indoor and outdoor selling space spanning three levels with rooftop parks, restaurants, barista bars and consumer facing RH Interior Design offices, and will enable us to place our disruptive product assortment and immersive retail experience into the market at a fraction of our former investment. Looking forward, we expect to accelerate our real estate transformation to a rate of 5 to 7 new Galleries in Fiscal 2020 and 7 or more new Galleries in Fiscal 2021.
Regarding trade with China, we do not expect the current tariffs to impair our ability to achieve stated financial goals and the impact from the increased tariffs is embedded in our guidance for the year. We continue to receive pricing accommodations from vendors and have implemented price increases where necessary with little to no impact to our business.
As it relates to our balance sheet, we ended the second quarter with inventory of $481 million versus $551 million last year, down $70 million, or 13% versus a 10% revenue increase. Due to the efficiency of our supply chain network redesign and the simplification of our reverse logistics and outlet model we expect to end the year with inventories down $80 to $90 million versus 2018. We are now projecting to generate free cash flow in the range of $325 to $350 million and expect total net debt to trailing twelve month adjusted EBITDA of approximately 1.8x to 1.9x at year end.
While we remain comfortable with our balance sheet, the current market conditions for convertible debt are attractive. As previously communicated, we will continue to be opportunistic as it relates to the capital markets. If there is an opportunity to issue convertible debt at acceptable terms, it could enable us to lower interest expense and increase adjusted diluted EPS by as much as $0.20 to $0.25 this year, and $0.65 to $0.70 next year, creating shareholder value and providing increased optionality for RH.
We believe our Company remains undervalued and will continue to evaluate share repurchases. Thus far in 2019, we have acquired 2.2 million shares at an average price of $115.36. Inclusive of our share repurchases in 2017 and 2018, we have repurchased 24.4 million shares at an average price of $61.40 per share, or approximately 60% of the total shares previously outstanding. We believe the repurchase of our shares will prove to be an outstanding allocation of capital for the benefit of our long term shareholders.
Looking forward, we continue to see a clear path to $4 to $5 billion in North America revenues, with mid-to-high teens operating margins and ROIC in excess of 50%. Additionally, we now believe there is an opportunity to more than double those revenues as we begin to expand globally, and move the brand beyond creating and selling products to conceptualizing and selling spaces.
Our long term targets remain:
Net revenue growth of 8% to 12%
Adjusted operating margins in the mid to high teens
Adjusted net income growth of 15% to 20% annually
Return on invested capital (ROIC) in excess of 50%
We do understand the strategies we are pursuing – opening the largest specialty retail experiences in our industry while most are shrinking the size of their retail footprint or closing stores; moving from a promotional to a membership model, while others are increasing promotions, positioning their brands around price versus product; continuing to mail inspiring Source Books, while many are eliminating catalogs; and refusing to follow the herd in self-promotion on social media, instead allowing our brand to be defined by the taste, design, and quality of the products and experiences we are creating – are all in direct conflict with conventional wisdom and the plans being pursued by many in our industry.
Ironically, I was reading an article in Forbes this morning with the headline “RH, (A.K.A. Restoration Hardware) Fails When It Comes To Digital.” The writer, Pamela Danziger, points to the Digital IQ Index published by Gartner L2, a consulting group who ranks the digital IQ of 103 specialty retailers with only Charlotte Russe keeping RH off the bottom of the ranking. She pointed out that Gartner L2’s principal specialty retail research analyst Supriya Jain mentioned, “For at least the last three years, RH has ranked in our (feeble) class in specialty retail”, and goes on to point out that every other directly competitive brand ranks higher, with Pier 1 ranking in the highest (gifted) class. I like to advise our team that it is dangerous to run your business or live your life based on other people’s thinking, especially ones who tend to be sideline critics and have no experience building a business like ours. I’m sure if Pamela, Supriya, and Gartner L2 did a Retail IQ Index that looked at earnings growth and shareholder value creation over the past three years across all channels, they would find RH’s placement in the hierarchy quite different. Or better yet, since 85% of retail sales are still done in stores, maybe a Retail Store IQ Index, ranking retailers on store performance or the metrics important to customers would be interesting, and most likely find us somewhere near the very top.
Nonetheless, somehow “feebly” we generate over a billion dollars in our digital channel, which also ranks above all the competitive brands mentioned in the article. We like to say on Team RH that “Leaders have to be comfortable making others uncomfortable.” It’s what leaders do, and when you know you’re on the right path, even when it makes others uncomfortable, or when they call you feeble.
We believe when you step back and consider: one, we are building a brand with no peer; two, we are creating a customer experience that cannot be replicated online; and three, we have total control of our brand from concept to customer, you realize what we are building is extremely rare in today’s retail landscape and, we would argue, will also prove to be equally valuable.
We would like to thank all of our people and partners whose passion and persistence bring our vision and values to life each and every day, as we pursue our quest to become one of the most admired brands in the world.
Carpe Diem,
Gary Friedman (CEO)
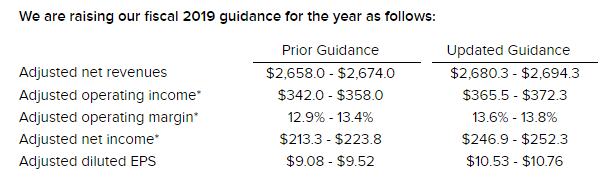
The image below shows the fiscal guidance provided by Restoration Hardware. The group raised their fiscal guidance.
To Our People, Partners, and Shareholders,
We are pleased to report another quarter of record results, and are raising our fiscal 2019 guidance for the third time this year. We generated record GAAP revenues of $706.5 million, an increase of 10.3%, record GAAP operating margin of 14.7%, record adjusted operating margin of 14.9%, record GAAP earnings per share of $2.86, and record adjusted diluted earnings per share of $3.20, a 59% increase versus $2.01 a year ago applying a 21% normalized tax rate in both years.
Our focus on elevating the brand, architecting an integrated operating platform, and pivoting the Company back to growth has resulted in RH standing out as one of the few brands that is growing revenues, expanding operating margins, and driving significantly higher returns on invested capital and free cash flow. Despite achieving industry leading operating margins, we continue to demonstrate our ability to grow earnings significantly faster than revenues, illustrating the desirability of our differentiated product offering, and the emergence of RH as a luxury brand generating luxury margins.
Second quarter adjusted net revenues increased 9.9% over last year reflecting the strength of our core RH business, the performance of our new galleries, particularly RH New York, the continued expansion of RH Hospitality and planned accelerated outlet sales due to the previously mentioned closure of a 500,000 square foot distribution facility in the fourth quarter of fiscal 2018. Additionally, we experienced better than expected delivered sales in the last few weeks of the quarter as a result of shipping efficiencies and lower returns due to the recent redesign of our home delivery network.
As a reminder, embedded in our 2019 guidance there is an approximate 3 point revenue reduction as a result of editing unprofitable and non-strategic businesses, namely the elimination of the remaining holiday business (1 point), the elimination of fringe promotions (1 point), and the transition of our rug business from a single source importer to a direct sourcing model (1 point). As planned, the drag was approximately 2 points in the first quarter, 4 points in the second quarter and we expect approximately 2 points in the third quarter and 4 points in the fourth quarter. Taking into account the approximate 4 point negative drag, adjusted net revenues would have increased 13.9% in the second quarter. We expect our new rug collection to contribute to both revenue and earnings growth in fiscal 2020.
Despite the increase in tariffs and some negative macro trends, we remain optimistic that our business momentum will continue, supported by a number of positive factors including by the recent mailing of the Fall Interiors and soon to be in-home Modern Source Books, the increasing contribution from RH Beach House, the launch of RH Ski House and new Galleries opening this fall.
Our largest and most important new Gallery, RH New York, continues to trend comfortably in excess of $100 million in annualized revenue for fiscal 2019 and will generate more than $30 million of cash contribution in its first full fiscal year. We are on track to open RH Minneapolis, the Gallery in Edina, RH Columbus, the Gallery at Easton Town Center, and RH Marin, the Gallery at the Village of Corte Madera, in the second half. These new prototype Galleries average 45,000 square feet of indoor and outdoor selling space spanning three levels with rooftop parks, restaurants, barista bars and consumer facing RH Interior Design offices, and will enable us to place our disruptive product assortment and immersive retail experience into the market at a fraction of our former investment. Looking forward, we expect to accelerate our real estate transformation to a rate of 5 to 7 new Galleries in Fiscal 2020 and 7 or more new Galleries in Fiscal 2021.
Regarding trade with China, we do not expect the current tariffs to impair our ability to achieve stated financial goals and the impact from the increased tariffs is embedded in our guidance for the year. We continue to receive pricing accommodations from vendors and have implemented price increases where necessary with little to no impact to our business.
As it relates to our balance sheet, we ended the second quarter with inventory of $481 million versus $551 million last year, down $70 million, or 13% versus a 10% revenue increase. Due to the efficiency of our supply chain network redesign and the simplification of our reverse logistics and outlet model we expect to end the year with inventories down $80 to $90 million versus 2018. We are now projecting to generate free cash flow in the range of $325 to $350 million and expect total net debt to trailing twelve month adjusted EBITDA of approximately 1.8x to 1.9x at year end.
While we remain comfortable with our balance sheet, the current market conditions for convertible debt are attractive. As previously communicated, we will continue to be opportunistic as it relates to the capital markets. If there is an opportunity to issue convertible debt at acceptable terms, it could enable us to lower interest expense and increase adjusted diluted EPS by as much as $0.20 to $0.25 this year, and $0.65 to $0.70 next year, creating shareholder value and providing increased optionality for RH.
We believe our Company remains undervalued and will continue to evaluate share repurchases. Thus far in 2019, we have acquired 2.2 million shares at an average price of $115.36. Inclusive of our share repurchases in 2017 and 2018, we have repurchased 24.4 million shares at an average price of $61.40 per share, or approximately 60% of the total shares previously outstanding. We believe the repurchase of our shares will prove to be an outstanding allocation of capital for the benefit of our long term shareholders.
Looking forward, we continue to see a clear path to $4 to $5 billion in North America revenues, with mid-to-high teens operating margins and ROIC in excess of 50%. Additionally, we now believe there is an opportunity to more than double those revenues as we begin to expand globally, and move the brand beyond creating and selling products to conceptualizing and selling spaces.
Our long term targets remain:
Net revenue growth of 8% to 12%
Adjusted operating margins in the mid to high teens
Adjusted net income growth of 15% to 20% annually
Return on invested capital (ROIC) in excess of 50%
We do understand the strategies we are pursuing – opening the largest specialty retail experiences in our industry while most are shrinking the size of their retail footprint or closing stores; moving from a promotional to a membership model, while others are increasing promotions, positioning their brands around price versus product; continuing to mail inspiring Source Books, while many are eliminating catalogs; and refusing to follow the herd in self-promotion on social media, instead allowing our brand to be defined by the taste, design, and quality of the products and experiences we are creating – are all in direct conflict with conventional wisdom and the plans being pursued by many in our industry.
Ironically, I was reading an article in Forbes this morning with the headline “RH, (A.K.A. Restoration Hardware) Fails When It Comes To Digital.” The writer, Pamela Danziger, points to the Digital IQ Index published by Gartner L2, a consulting group who ranks the digital IQ of 103 specialty retailers with only Charlotte Russe keeping RH off the bottom of the ranking. She pointed out that Gartner L2’s principal specialty retail research analyst Supriya Jain mentioned, “For at least the last three years, RH has ranked in our (feeble) class in specialty retail”, and goes on to point out that every other directly competitive brand ranks higher, with Pier 1 ranking in the highest (gifted) class. I like to advise our team that it is dangerous to run your business or live your life based on other people’s thinking, especially ones who tend to be sideline critics and have no experience building a business like ours. I’m sure if Pamela, Supriya, and Gartner L2 did a Retail IQ Index that looked at earnings growth and shareholder value creation over the past three years across all channels, they would find RH’s placement in the hierarchy quite different. Or better yet, since 85% of retail sales are still done in stores, maybe a Retail Store IQ Index, ranking retailers on store performance or the metrics important to customers would be interesting, and most likely find us somewhere near the very top.
Nonetheless, somehow “feebly” we generate over a billion dollars in our digital channel, which also ranks above all the competitive brands mentioned in the article. We like to say on Team RH that “Leaders have to be comfortable making others uncomfortable.” It’s what leaders do, and when you know you’re on the right path, even when it makes others uncomfortable, or when they call you feeble.
We believe when you step back and consider: one, we are building a brand with no peer; two, we are creating a customer experience that cannot be replicated online; and three, we have total control of our brand from concept to customer, you realize what we are building is extremely rare in today’s retail landscape and, we would argue, will also prove to be equally valuable.
We would like to thank all of our people and partners whose passion and persistence bring our vision and values to life each and every day, as we pursue our quest to become one of the most admired brands in the world.
Carpe Diem,
Gary Friedman (CEO)
The image below shows the fiscal guidance provided by Restoration Hardware. The group raised their fiscal guidance.
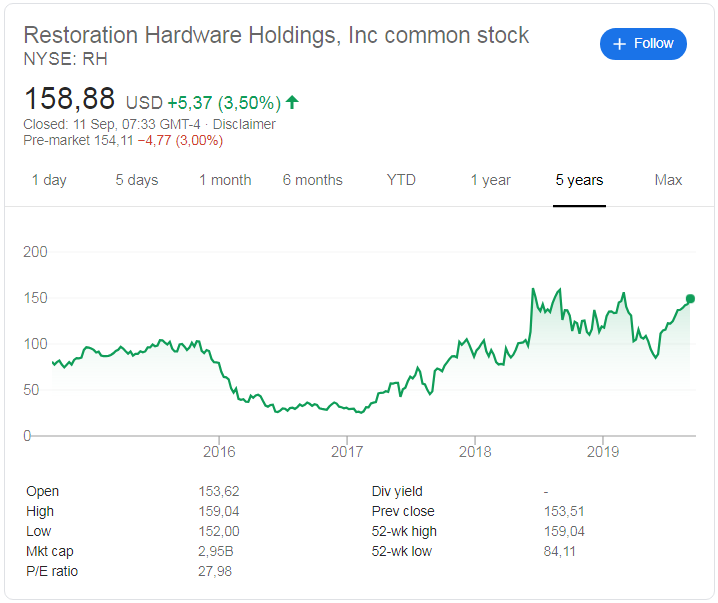
Restoration Hardware (NYSE: RH) stock price history
The image below, obtained from Google shows the stock price history of Restoration Hardware over the last 5 years. And its been a very volatile but overall a good time for stockholders of Restoration Hardware with the stock trading around $80 five years ago, and its currently trading at $155.88. That's a very healthy return of 98.6% over the last 5 years being provided by Restoration Hardware to stockowners. The stock is trading at very close to its 52 week high of $159.04 and is far away from its 52 week low of $84.11, which is a clear indication that short term sentiment and momentum of Restoration Hardware is overwhelmingly positive.
Recent coverage of Restoration Hardware
The extract below touches on the latest results from Restoration Hardware, as obtained from Zacks.
Restoration Hardware (RH) came out with quarterly earnings of $3.20 per share, beating the Zacks Consensus Estimate of $2.70 per share. This compares to earnings of $2.05 per share a year ago. These figures are adjusted for non-recurring items. This quarterly report represents an earnings surprise of 18.52%. A quarter ago, it was expected that this furniture and housewares company would post earnings of $1.54 per share when it actually produced earnings of $1.85, delivering a surprise of 20.13%.
Over the last four quarters, the company has surpassed consensus EPS estimates four times. Restoration Hardware, which belongs to the Zacks Retail - Home Furnishings industry, posted revenues of $706.51 million for the quarter ended July 2019, surpassing the Zacks Consensus Estimate by 1.22%. This compares to year-ago revenues of $642.65 million. The company has topped consensus revenue estimates three times over the last four quarters. The sustainability of the stock's immediate price movement based on the recently-released numbers and future earnings expectations will mostly depend on management's commentary on the earnings call .
Restoration Hardware shares have added about 28.1% since the beginning of the year versus the S&P 500's gain of 18.8%.
Restoration Warehouse (NYSE: RH) latest stock valuation
So based on Restoration Warehouse's latest earnings report what are their stock currently worth? Based on Restoration warehouse's curren earnings report and the updated fiscal guidance provided we have a target (full value) price in the stock at $172.20. So we believe at its current price it is undervalued. However for fundamental long term or value investors we would recommend looking to enter Restoration Warehouse stock at, at least 10% below our target (full value) price. We would therefore suggest looking to buy at around $154.80 or below.