|
Related Topics
|
|
Category: Stock Market and Investing
Last updated: 18 January 2021 This page is dedicated to doing stock performance comparisons. We will look to compare stocks listed on various exchanges such as the Dow Jones (DJIA), New York Stock Exchange (NYSE) and NASDAQ that operate in similar sectors and compare their performance over time against one another. We will also compare stock market indices from across the world to that of US stock market indices.
|
|
Our YouTube channel is now live. Watch short summary videos of our articles
While the trends are very similar the stock of Facebook has comfortably outperformed that of Alphabet over the last 5 and half odd years. "
18 January 2021: Wells Fargo (WFC) vs JPMorgan (JPM) vs Citi (C)
The image below shows the stock price performance of Bank of Wells Fargo (WFC), JPMorgan Chase (JPM), Citigroup (C) over the last 5 years. All of these firms are active in the banking and financial services sector in the USA. And their stock price trends look very similar, but the stock price returns are however very different. The summary below shows the stock price returns of the four mentioned firms over the last 5 years, sorted from best to worst performer
JPMorgan was by far the best performer and Wells Fargo by far the worst.
- JPMorgan Chase (JPM): 161.2%
- Citigroup (C): 83.6%
- Wells Fargo: 4.2%
JPMorgan was by far the best performer and Wells Fargo by far the worst.
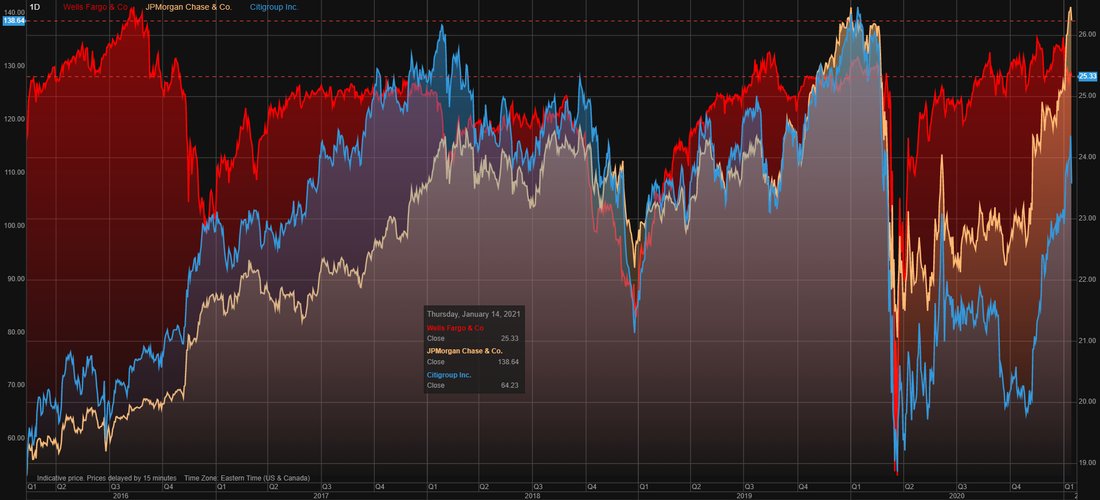
Wells Fargo (WFC) vs Citi (C) vs JPMorgan (JPM) stock price comparison chart
One of our key metrics is the Price to Stockholders equity per share ratio. When looking at this we find the following:
Based on this metric CitiGroup offers far more value than Wells Fargo and JPMorgan. Most firms tend to trade at a ratio of between 2 and 5 times. While all these firms are trading at well below the expected range its Citi who is trading at the lowest and based on this metric offers the most value.
Next up cash as percentage of stock price:
Next up lets take a look at the percentage cash on the balance sheet makes up of each group's total assets:
Looking at the cash position of the three firms Wells Fargo has the strongest cash position (as a percentage of their total assets). The cash per share gives an indication of if investors were to buy the stock now, how much of that stock price is made up by cash on their balance sheet. In this case its also Wells Fargo that comes out on top with almost 21.9% of their current stock price being made up by cash.
Next the overused but still useful metric, the Price to Earnings Ratio (PE):
So Citigroup has the lowest PE and Wells Fargo by far the highest.
Price/Stock Valuation ratio:
So all things considered if we have to choose between all of these financial service provider firms based on their current stock price, their latest earnings reported and stock price performance provided over the last 5 years, we rate the stock of CitiGroup as the Winner.
Its PE is the lowest of the three firms, it offers the most value when looking at our Price/Stock Valuation ratio, with it trading at almost 34% discount to our valuation, it has the second strongest cash position (based on cash as percentage of market capital as well as cash as percentage of total assets). And Citi offers the most value in terms of our Price/Stockholders equity per share metric. Therefore we rate the stock of Citi (C) as the clear winner in our latest battle of the banks.
- Price/Stockholders equity per share for CitiGroup: 0.69
- Price/Stockholders equity per share for JP Morgan : 1.35
- Price/Stockholders equity per share for Wells Fargo : 0.72
Based on this metric CitiGroup offers far more value than Wells Fargo and JPMorgan. Most firms tend to trade at a ratio of between 2 and 5 times. While all these firms are trading at well below the expected range its Citi who is trading at the lowest and based on this metric offers the most value.
Next up cash as percentage of stock price:
- Cash as percentage of stock price for CitiGroup: 19.2%
- Cash as percentage of stock price for JP Morgan : 5.8%
- Cash as percentage of stock price for Wells Fargo: 21.9%
Next up lets take a look at the percentage cash on the balance sheet makes up of each group's total assets:
- Cash as percentage of stock price for CitiGroup: 1.2%
- Cash as percentage of stock price for JP Morgan : 0.74%
- Cash as percentage of stock price for Wells Fargo: 1.4%
Looking at the cash position of the three firms Wells Fargo has the strongest cash position (as a percentage of their total assets). The cash per share gives an indication of if investors were to buy the stock now, how much of that stock price is made up by cash on their balance sheet. In this case its also Wells Fargo that comes out on top with almost 21.9% of their current stock price being made up by cash.
Next the overused but still useful metric, the Price to Earnings Ratio (PE):
- PE for CitiGroup: 7.8
- PE for JP Morgan : 9.2
- PE for Wells Fargo: 12.6
So Citigroup has the lowest PE and Wells Fargo by far the highest.
Price/Stock Valuation ratio:
- Price/Stock Valuation for CitiGroup: 0.66
- Price/Stock Valuation for JP Morgan : 1.02
- Price/Stock Valuation for Wells Fargo: 0.79
So all things considered if we have to choose between all of these financial service provider firms based on their current stock price, their latest earnings reported and stock price performance provided over the last 5 years, we rate the stock of CitiGroup as the Winner.
Its PE is the lowest of the three firms, it offers the most value when looking at our Price/Stock Valuation ratio, with it trading at almost 34% discount to our valuation, it has the second strongest cash position (based on cash as percentage of market capital as well as cash as percentage of total assets). And Citi offers the most value in terms of our Price/Stockholders equity per share metric. Therefore we rate the stock of Citi (C) as the clear winner in our latest battle of the banks.
27 October 2020: Simpson Manufacturing (SSD) vs Illinois Tool Works (ITW) over last 5 years
The image below shows the stock price history of Simpson Manufacturing (SSD) and Illinois Tool Works (ITW) over the last years. Both are large manufacturing firms and their stock price trends are pretty similar. The summary below shows the returns provided by the two manufacturing firms over the last 5 years
The stock of Simpson Manufacturing has easily outperformed that of Illinois Tool Works (ITW) over the last 5 years.
- Simpson Manufacturing (SSD): 152.9%
- Illinois Tool Works (ITW): 114.2%
The stock of Simpson Manufacturing has easily outperformed that of Illinois Tool Works (ITW) over the last 5 years.
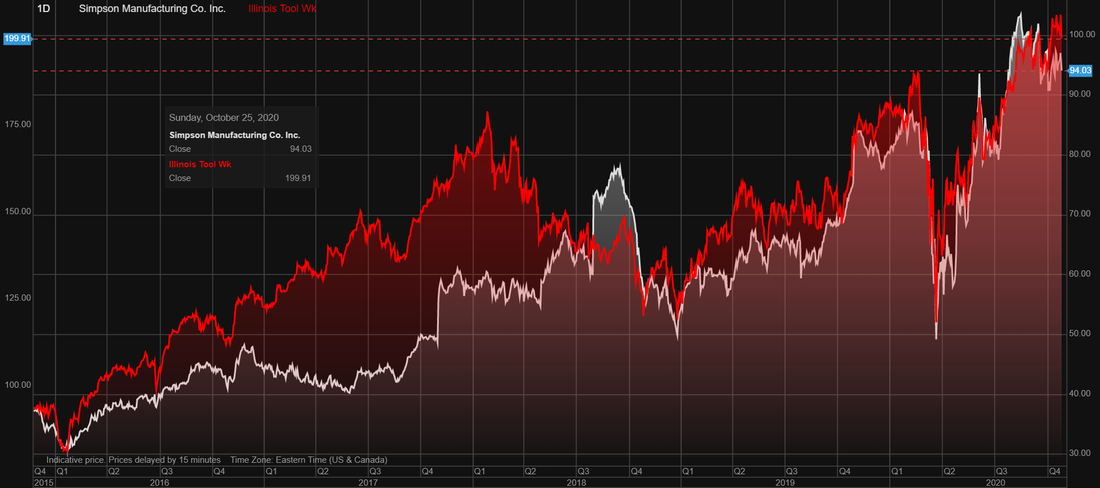
27 October 2020: Simpson Manufacturing (SSD) vs Illinois Tool Works (ITW) over last 5 years
12 July 2020:
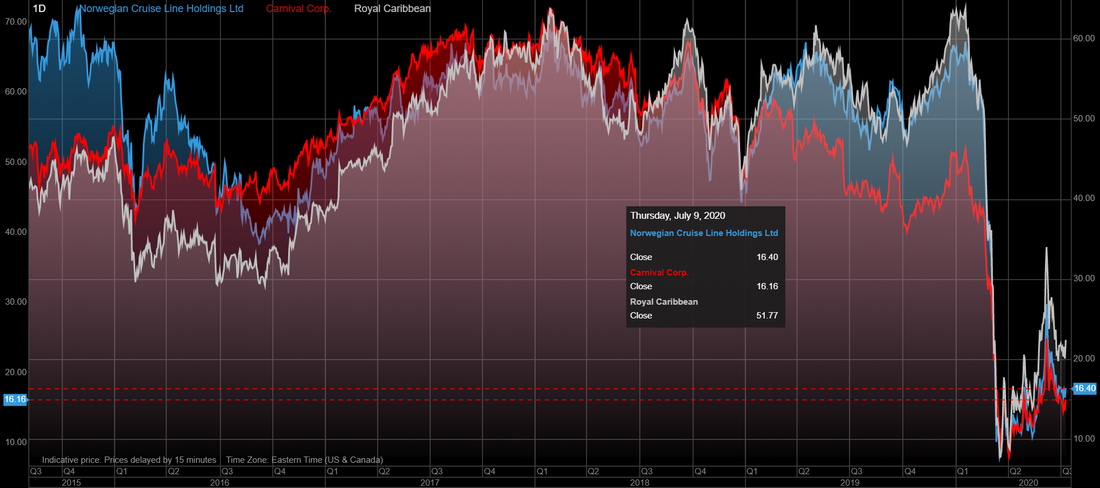
Norwegian Cruise Line (NCLH) vs Carnival Corporation (CCL) vs Royal Caribbean (RCL)
The image below shows the stock price performance of the three major listed cruise ship companies over the last 5 years. They are Norwegian Cruise Line (NCLH), Carnival Corporation (CCL) and Royal Caribbean Cruises (RCL). As the image shows their stock price trends are very similar and they all recorded massive slumps since the start of 2020.
Over the 5 year period the stock price performance of the three cruise ship companies are as follows (sorted from best performer to worst performer):
Over the 5 year period the stock price performance of the three cruise ship companies are as follows (sorted from best performer to worst performer):
- Royal Caribbean Cruises: -42.28%
- Carnival Corporation: -68.89%
- Norwegian Cruise Line: -72.73%
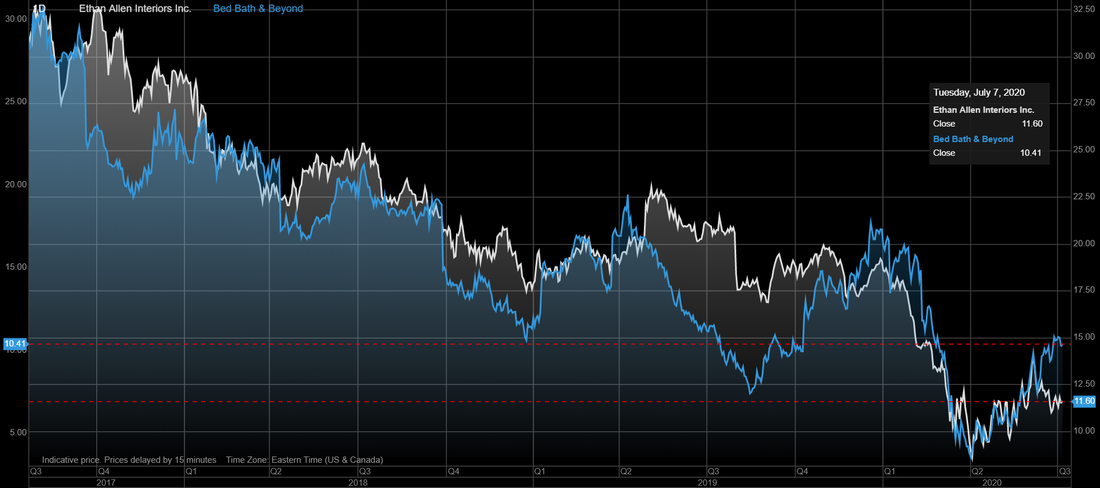
9 July 2020: Bed Bath and Beyond (BBBY) vs Ethan Allen (ETH)
The image below shows the stock price performance of Bed Bath and Beyond (BBBY) and Ethan Allen (ETH). Both companies are active in the interior decorating space. As the image above shows the stock price history of BBBY is pretty depressing, but they are not the only ones active in this space that is struggling. As the stock price comparison between BBBY and ETH show both these firms stocks have had a pretty dismal time over the last three years.
Over the last 3 years the stock of Bed Bath and Beyond declined by -63.05% while the stock of Ethan Allen (ETH) declined by -62.28%. So pretty horrible numbers for both these firms.
Over the last 3 years the stock of Bed Bath and Beyond declined by -63.05% while the stock of Ethan Allen (ETH) declined by -62.28%. So pretty horrible numbers for both these firms.
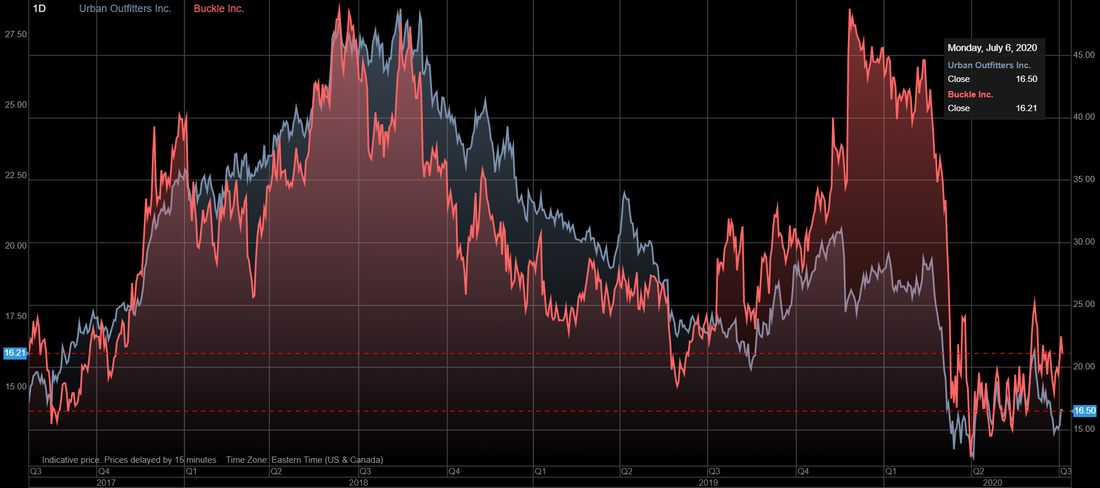
8 July 2020: Urban Outfitters (URBN) vs Buckle (BKE) stock price comparison over last 3 years
The image below shows the stock price performance of Urban Outfitters (URBN) and Buckle (BKE) over the last 3 years. Both firms are active in the clothing and accessories sector and their share price performances are very similar. Over the three year period the stock of Urban Outfitters (URBN) declined by -5.5% while the stock of Buckle (BKE) declined by -0.5%
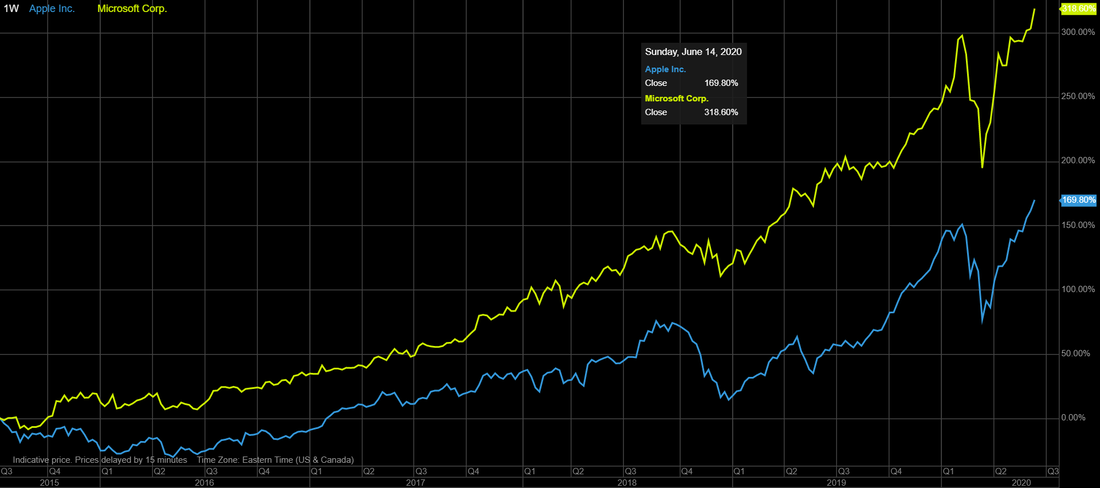
22 June 2020: Apple Inc (APPL) stock vs Microsoft (MSFT) stock over the last 5 years
The image below shows the stock price performance of two tech giants in Apple Inc (APPL) and Microsoft (MSFT) over the last 5 years. And while both stocks have had storming runs over the last 5 years the stock of Microsoft has easily outperformed that of Apple over the last 5 years. Over the 5 year period the stock of Microsoft has increased by 318.60% compared to Apple whose stock has increased by 169.8% over the same time period. While neither of these firms returns are to be snuffed at we hope that if you had to choose between Apple (APPL) and Microsoft (MSFT) 5 years ago, you picked Microsoft (MSFT)
22 June 2020: Apple Inc (APPL) stock vs Microsoft (MSFT) stock over the last 5 years
15 June 2020: Southwest Airlines (LUV) vs American Airlines (AAL) vs Delta Airlines (DAL)
The image below shows the stock price performance of Southwest Airlines (LUV), American Airlines (AAL) and Delta Airlines (DAL) over the last 3 years. And from the image it is clear that its not been a good time for any of the airlines over the last 3 years. Especially since the start of February 2020. Over the three year period the stock of Southwest Airlines declined by -44.26%, while Delta Airlines declined by -46.24% and American Airlines declined by a whopping 68.90% over the last 3 years. American Airlines is by far the worst performer of the three
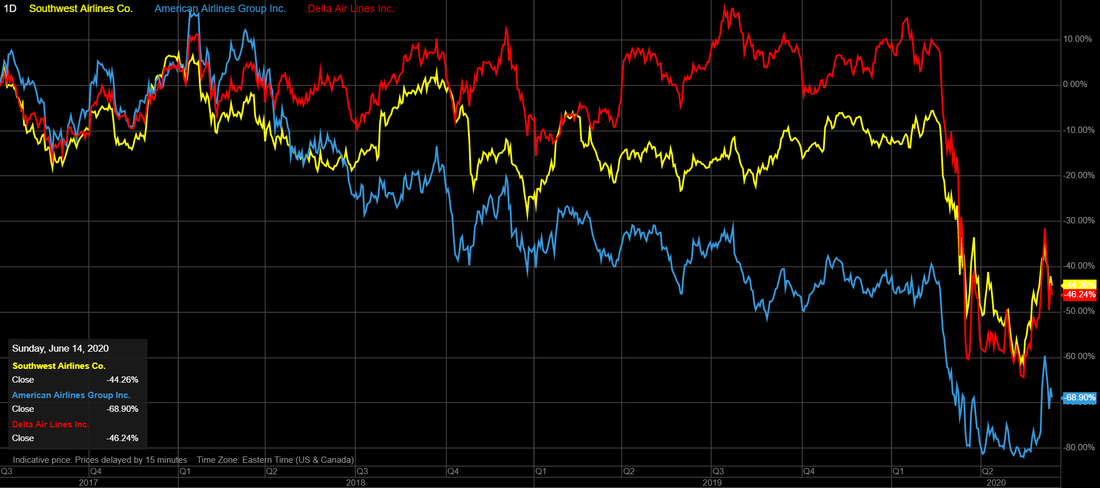
Question is whether it is the right time to take a punt on the airline stocks that have been battered over the last few months? Surely Covid-19 will pass and travel and flights will start picking up again. The question is whether these companies will still be around then, and in what state would their business be in once things starts normalising again?
11 June 2020: Brown-Forman (BF.B) stock vs Diageo (DGE) stock
The comparison below shows the stock price performance of Brown-Forman (BF.b) and Diageo PLC (DGE) over the last 3 years. Both of these firms are active in the distillery and liquor manufacturing and distribution market, although these firms are listed on different stock exchanges. Over the last 3 years the stock of Brown-Forman (owner of brands such as Jack Daniels and el Jimador tequila) has provided a return of 21.81% while Diageo (owner of brands such as Johny Walker and Bailey's) provided a return of 2001% over the last 3 years
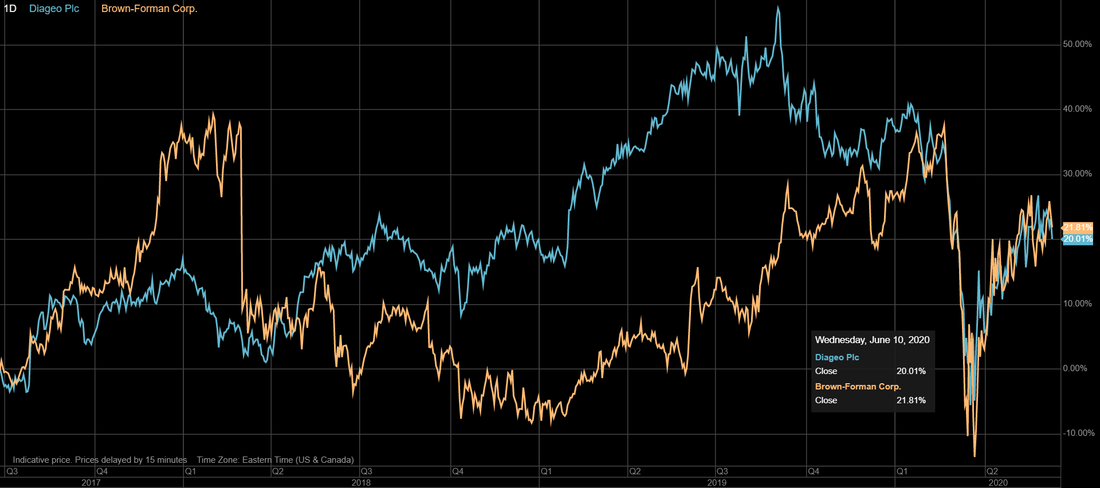
Brown-Forman (BF.B) stock vs Diageo (DGE) stock
21 May 2020: Booking Holdings vs Trivago vs Royal Caribbean vs Carnival Corp vs Six Flags
The image below shows four stock charts, all of them containing the stock price performance of Booking Holdings (the light blue lines in each graphic) over the last 3 years. The only difference in the four charts are the stocks that Booking Holdings is compared against over the three year period. As the heading states the stocks that we compared Booking Holdings against are:
The reason we selected these stocks is the fact that they are all operating in the tourism and entertainment industry and they have all been hit very hard by the Covid-19 pandemic.
- Trivago (TRVG) - Top left graphic
- Royal Caribbean (RCL) - Top right graphic
- Carnival Corporation (CCL)- Bottom left graphic
- Six Flags (SIX) - Bottom right graphic
The reason we selected these stocks is the fact that they are all operating in the tourism and entertainment industry and they have all been hit very hard by the Covid-19 pandemic.
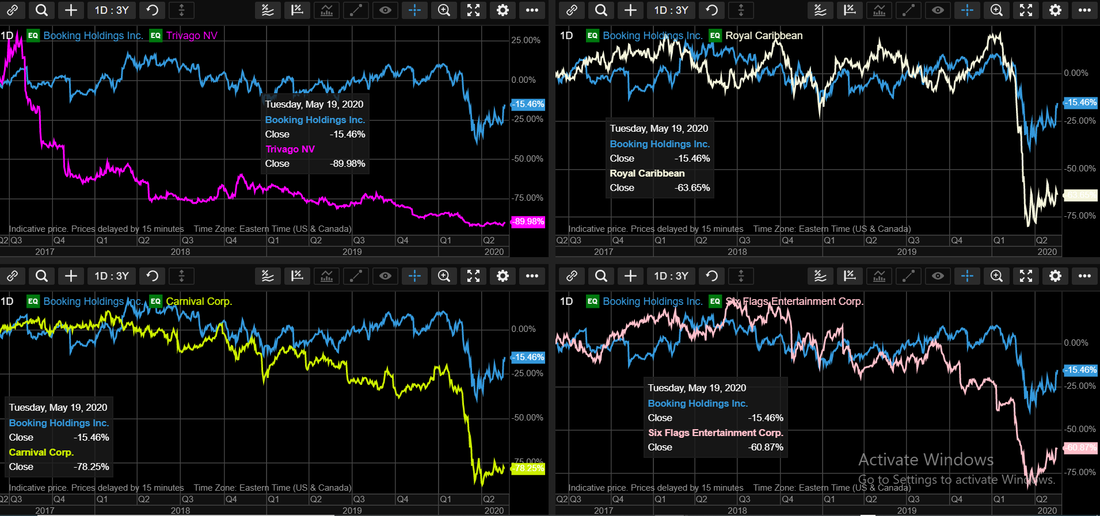
In the image above readers might have noticed the fact that in every single one of these graphics Booking Holdings (BKNG) had the best performance over the three year period. Below a summary of the performance of Booking against the other stocks mentioned;
- Booking Holdings -15.46%
- Six Flags Entertainment: - 60.87%
- Royal Caribbean: -63.65%
- Carnival Corporation:-78.25%
- Trivago: -89.98%
18 May 2020: Booking Holdings (NASDAQ: BKNG) vs Trivago (NASDAG: TRVG)
The comparison below shows the stock price performance of Booking Holdings (NASDAQ: BKNG) vs Trivao ADR (NASDAQ: TRVG). Both of these companies are active in the online hotel and accommodation booking industry. But as the graphic below shows the stock of Trivago has been hit particularly hard in the last 3 years, well in advance of Covid-19. Towards the end of 2017 the stock of Trivago plunged and it continued to do so, with very little respite. And Covid-19 wont help the company and its stock cause at all.
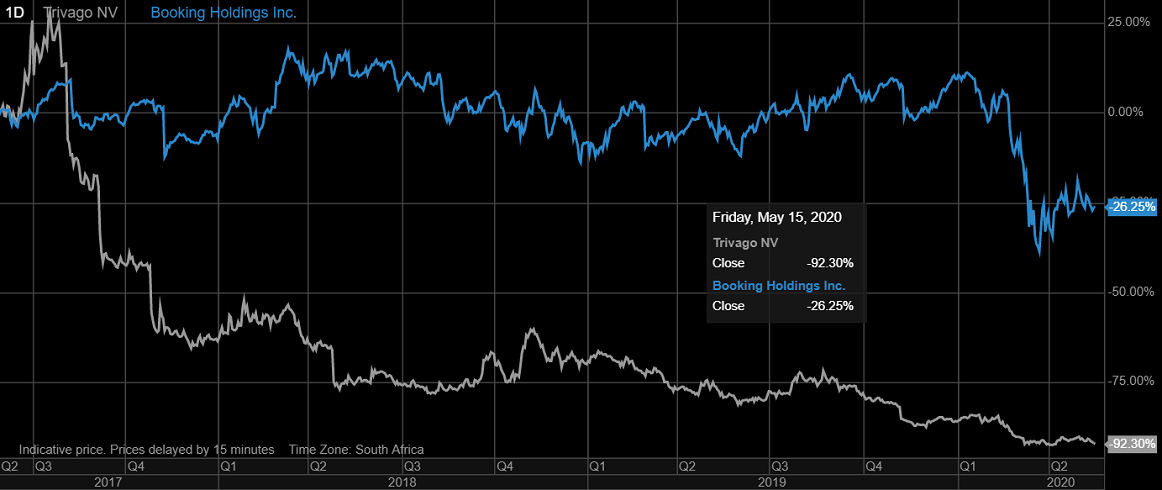
Booking Holdings (NASDAQ: BKNG)) vs Trivago (NASDAQ: TRVG)
Over the last 3 years Booking Holdings stock lost -26.25% while the ADR of Trivago declined by a whopping -92.3%. No comparison between these two companies. You would have been far better of investing your money in Booking instead of Trivago over the last 3 years, and we predict this to hold true for the next three years.
18 May 2020: Uber (NYSE:UBER) vs Grub Hub (NYSE: GRUB)
Before we take a look at the stock price comparison between Uber and Grubhub lets take a look at the news that Uber is making a bid to acquire the stock of GrubHub. Below a short extract as obtained from Fortune.
If it wasn't already clear, Uber's blockbuster acquisition bid for Grubhub, revealed this week, made it abundantly so: Delivering burgers, lasagna, and Kung Pao chicken has become a huge business—and the focus of a big battle for dominance. Uber's proposed takeover of Grubhub for an undisclosed price, reported by Bloomberg on Thursday, would catapult Uber into being the largest U.S. food delivery service. A combined Uber-Grubhub would control nearly half of the food delivery market, according to research firm Edison Trends, versus 45% for rival DoorDash.
Read the full article here
Now lets move to the stock performance comparison between Uber (NYSE: UBER) and GrubHub (NYSE: GRUB)
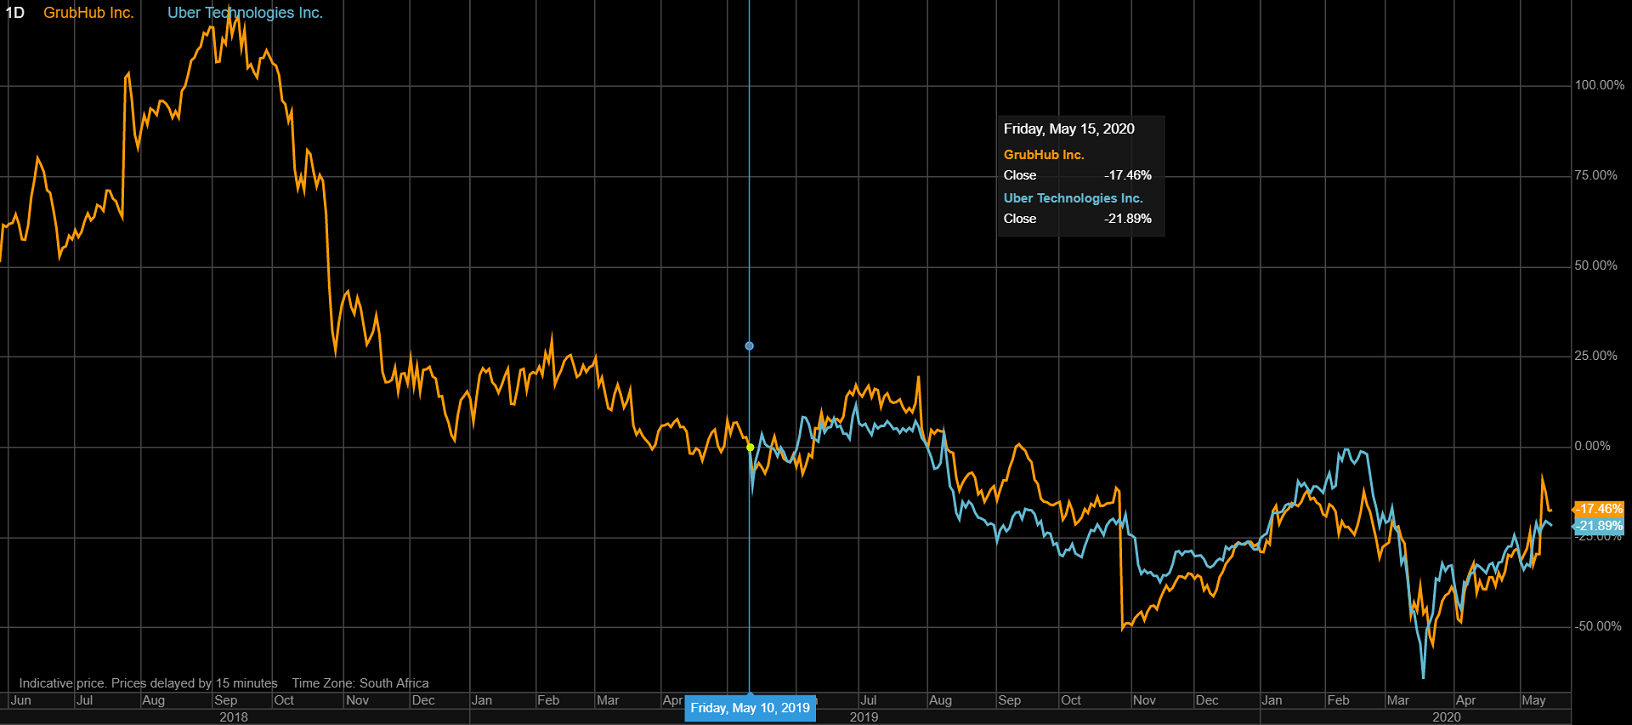
Uber (NYSE:UBER) stock performance vs GrubHub (NYSE: GRUB) stock price performance since Uber's listing date
The image above shows the stock price performance of Uber and GrubHub since Uber's listing date. Since Uber's listing the stock of Uber has declined by -21.89% while the stock of GrubHub has declined by -17.46%. The trends and level of performance of Uber and GrubHub is actually very similar over this time period. So no point in cracking your head as to which one of these to buy, they follow similar trends and both provided losses in recent years. But if you have to buy one of these, buy Uber as it looks like their deal with GrubHub will go through. And they have a more diversified portfolio considering their ride hailing arm too.
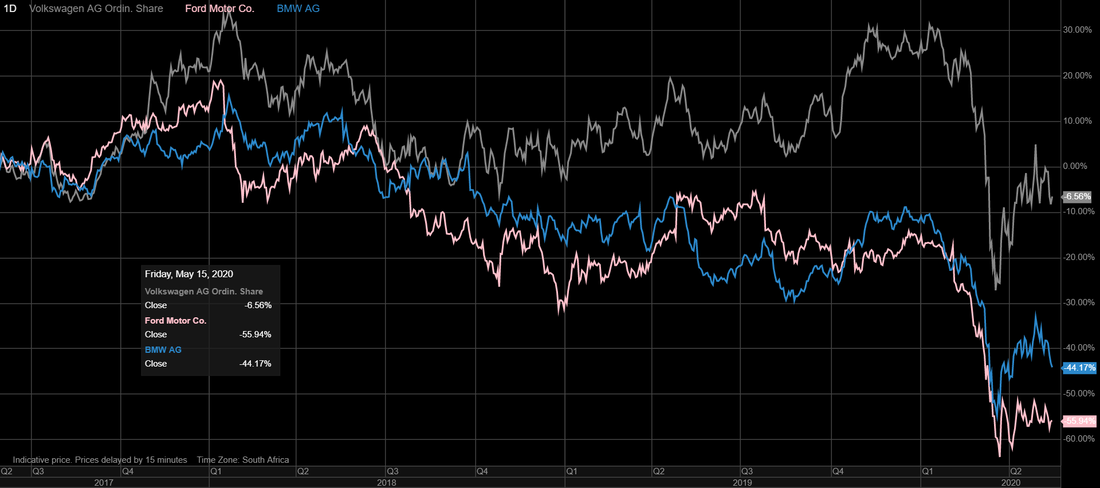
16 May 2020: Ford (NYSE:F) vs Volkswagen (ETR: VOW) vs BMW (ETR: BMW)
This comparison compares the stock price performance of Ford, Volkswagen and BMW over the last 3 years. As the image below shows its not been a very good time for motor vehicle manufacturers with not one of the three providing positive returns over this period. The summary below shows the stock price performance of the three over the last 3 years:
- Volkswagen: -6.56%
- BMW: -44.17%
- Ford: -55.94%
14 May 2020: Eli Lilly (NYSE: LLY) vs Merck & Co (NYSE: MRK)
The comparison below compares the stock price performance of Eli Lilly to that of Merck & Co over the last 3 years. While the trends are fairly similar between these two drug making firms the stock of Eli Lily has diverged a bit from Merck in recent months.
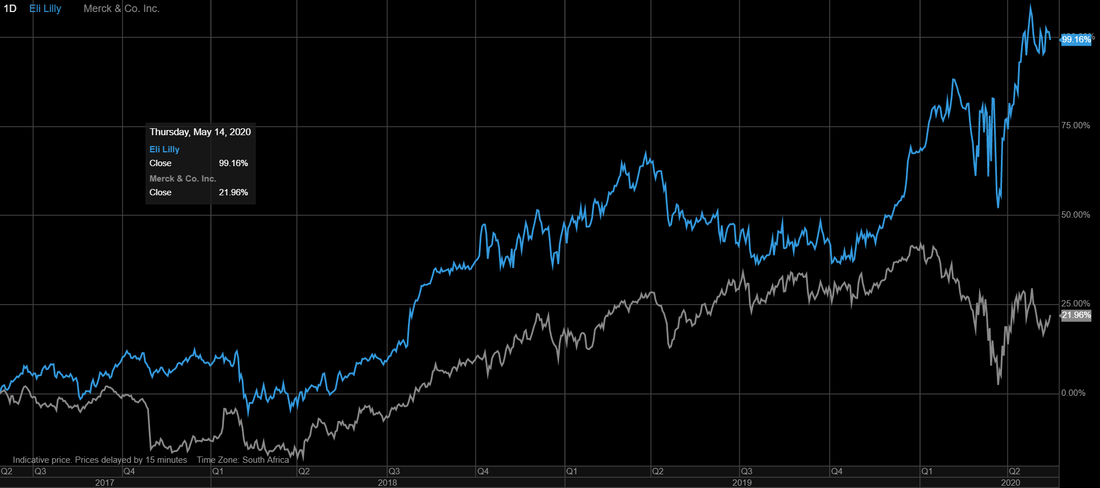
Over the last 3 years Eli Lilly has returned 99.16% to stockholders while the stock of Merck & Co returned 21.96% to stockholders over the same time period. So if you were looking to invest in a drugs maker a few years ago, we hope you selected Eli Lily.
13 May 2020: Apple (NASDAQ: AAPL) vs Samsung Electronics (LI: SMSN)
This comparison takes a look at the stock price performance over the last three years of Samsung Electronics (listed on London's International Exchange) and Apple Inc (NASDAQ: AAPL). So of these electronic equipment maker giants (cell phones in particular) whose stock price has performed better?
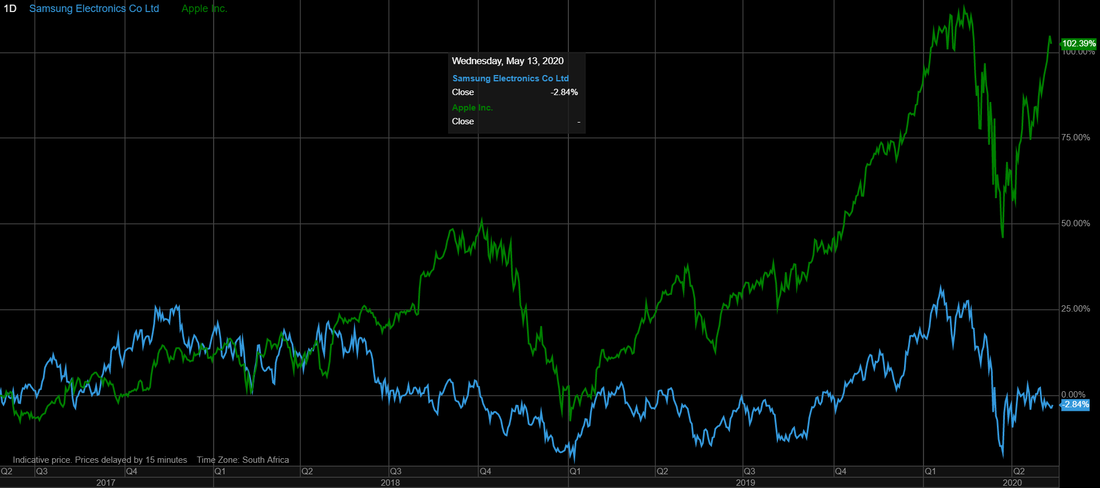
Apple Inc (APPL) vs Samsung Electronics (SMSN)
As the image above shows the performance of Apple Inc (APPL) far outstripped that of Samsung Electronics (SMSN) over the three year period. Over the last 3 years APPL provided 102.39% to stockholders while Samsung Electronics stock declined by -2.84% over the last 3 years (based on the listing of SMSN on the London International Exchange in US dollars)
13 May 2020: Home Depot (NYSE: HD) vs Foundation Building Materials (NYSE: FBM)
Lets took at the stock price performance over the last 3 years of two building and DIY product suppliers. We compare the stock price performance of Home Depot (HD) to that of Foundation Building Materials. From the image below it is clear that the stock price performance of Foundation Building Materials is a lot more volatile than that of Home Depot, with its peaks and throughs being far more pronounced
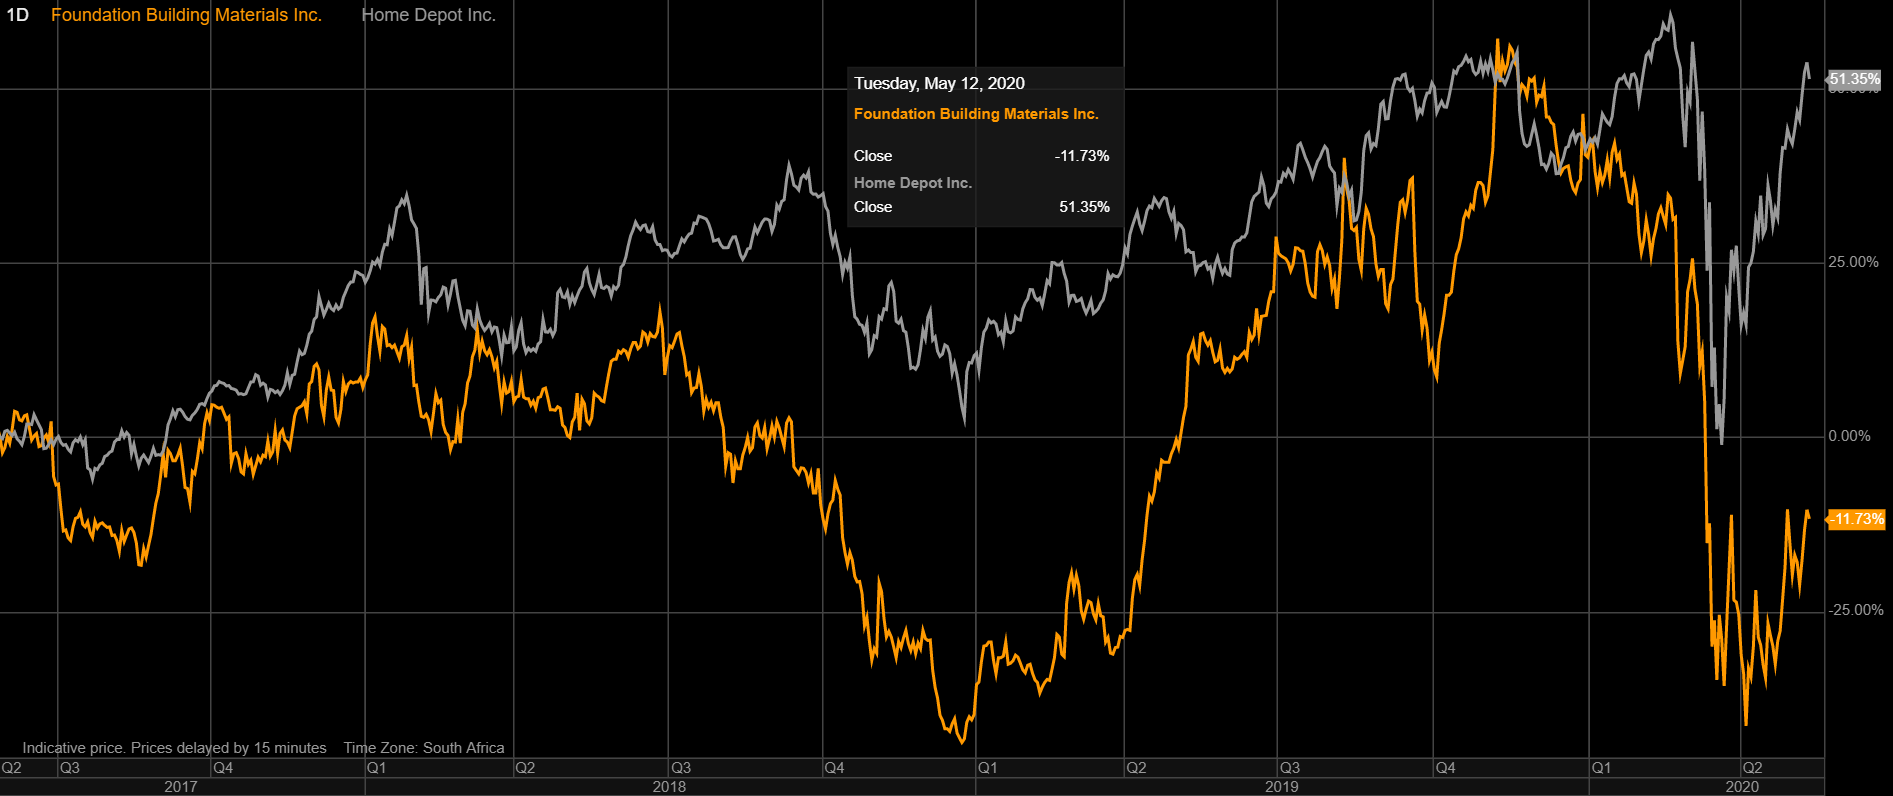
Home Depot (HD) stock performance vs Foundation Building Materials (FBM) stock performance
Over the last 3 years the stock of Home Depot (HD) has provided stockholders with a return of 51.35% while the stock of Foundation Building Materials (FBM) has returned a loss of -11.73% over the same period of time. If its consistency you want go for Home Depot, if you in to a wild ride and looking to make a fast buck buy Foundation Building Materials in the dips.
12 May 2020: Booking Holdings (NASDAQ:BKNG) vs Hilton Worldwide (NYSE: HLT)
In this comparison we compare two stocks active in the tourism and hospitality sector. The one provides a platform to book hotels, flights and restaurants (Booking Holdings) while the other owns a wide ranging portfolio of lodges and hotels (Hilton Worldwide). The image below shows the stock price performance of these two stocks over the last 3 years.
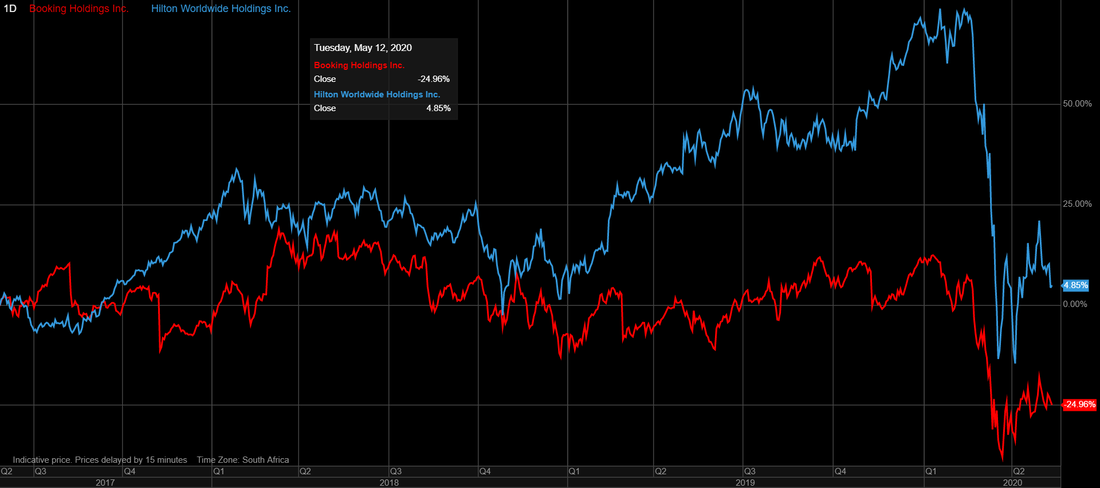
Booking Holdings (NASDAQ: BKNG) stock performance vs Hilton Worldwide (NYSE: HLT) stock performance
Over the last 3 years the stock of Booking Holdings declined by -24.96% while the stock of Hilton Worldwide increased by 4.85%. So while the trends of these two stocks are very similar the extent and level of the moves of Booking Holdings and Hilton Worldwide is very different. With Hilton Worldwide tending to be the better performer between the two over the last 3 years.
12 May 2020: Boston Beer Company (NYSES:SAM) vs TsingTao Breweries (HKG: 0168)
In this comparison we take a look at the stock price performance of Boston Beer Company and compare it to the 2nd largest brewery in China,TsingTao Breweries over the last 3 years. The image below shows the returns provided by the respective stocks on their respective stock exchanges in their respective currencies. Boston Beer Company is listed on the New York Stock Exchange (NYSE) and is traded n US dollars while TsingTao Breweries is listed on the Hong Kong Stock Exchange and is traded in Hong Kong Dollars

TsingTao Brewery stock price vs Boston Beer Company stock price over the last 3 years
Over the period in question the stock of Boston Beer Company recorded an increase of 232.16% while the stock of TsingTao recorded an increase of 36.04% over the same period. The returns of Boston Beer Company therefore far outweighs that of the 2nd biggest brewery in in China
11 May 2020: Ford (NYSE: F) vs Ferrari (MIL:RACE)
So while Ferrari and Ford might be rivals on the race track, when it comes to their respective stock price performances there is absolutely no comparison between the two. The image below shows the stock price returns of both Ford and Ferrari since the start of 2016. And the performance of Ferrari far outstrips that of Ford.
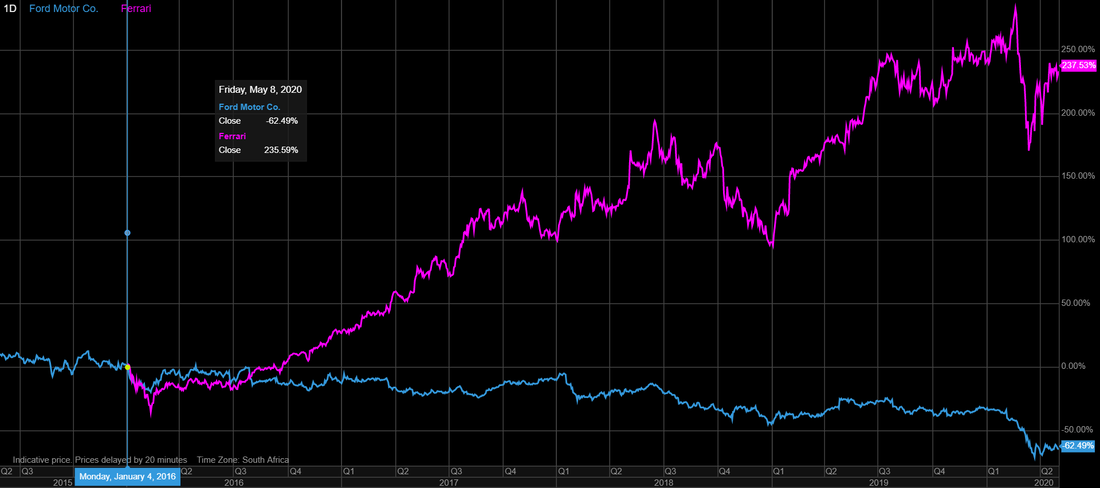
So over the period in question the stock of Ferrari returned 235.6% while the stock of Ford declined by -62.49%. So while on race tracks and in racing they might be close, when it comes to stock price performance there is absolutely no comparison with the stock of Ferrari easily outrunning the stock of Ford.
11 May 2020: Facebook (NASDAQ: FB) vs Alphabet (NASDAQ: FB)
The image below shows the stock price performance of Alphabet (NASDAQ: GOOG) and Facebook (NASDAQ:FB) since the start of 2016. And as the graphic shows the stock price returns of both Alphabet, the parent of Google and Youtube is very similar to that of Facebook. As at the close of business on 8 May, Alphabet returned 87.15% to investors over the period in question compared to Facebook that has returned 107.14% to investors. While the trends are very similar the stock of Facebook has comfortably outperformed that of Alphabet over the last 5 and half odd years.
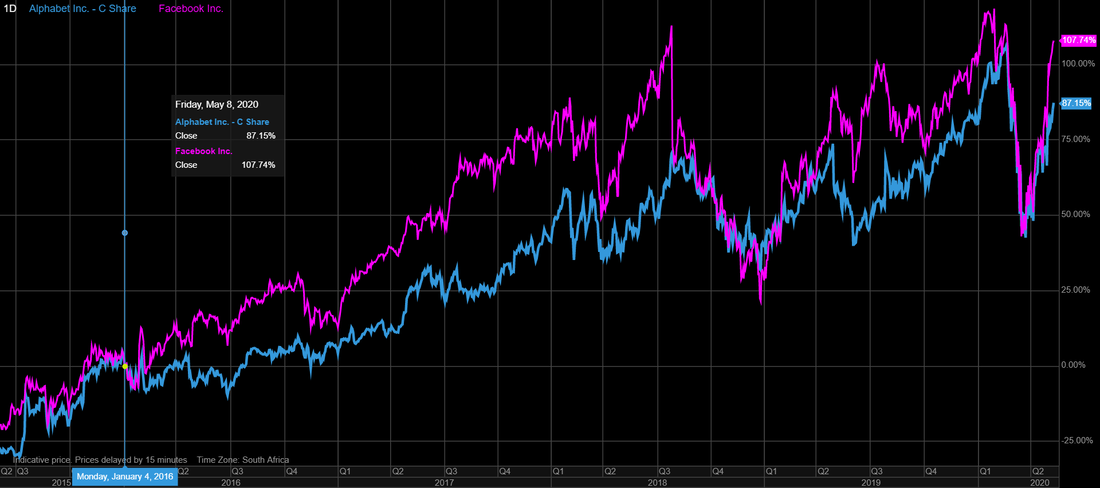
Alphabet (NASDAQ:GOOG) stock performance vs Facebook (NASDAQ:FB) stock price performance