
|
Related Topics
|
|
Category: Dow Jones Industrial Average (DJIA)
Last updated: 1 July 2020 (03:28 ET) This page takes a look at the performance of the Dow Jones Industrial Average (DJIA) for the month of June 2020 on a calendar. Its been a pretty wild ride so far during June 2020. Tesla close to record highs, the FED promising more buying and second wave coronavirus fears.
|

|
The index covers all industries except transportation and utilities. The market cap of the Dow Jones firms amounts to $7.902 trillion as at end of May 2020. "
About the Dow Jones Industrial Average (DJIA)
The Dow Jones Industrial Average® (The Dow®), is a price-weighted measure of 30 U.S. blue-chip companies. The DJIA covers all industries except transportation and utilities. The market cap of the Dow Jones firms amounts to $7.902 trillion as at end of May 2020. The Dow Jones Industrial Average has a trailing PE ratio of 19.41 and the PE is projected (forward PE) is at 21.66 with a indicated dividend yield of 2.79% and a price to book value of 3.71.
Dow Jones Industrial Average (DJIA) performance during June 2020
The graphic below shows the daily performance of the Dow Jones Industrial Average (The Dow) on a calendar for the month of June 2020. The index levels used in the calculation of the daily performance of the Dow Jones Industrial Average is obtained from Macrotrends.net
So the volatile behaviour of the Dow Jones continues with a mixed bag of up and down days during June 2020. So for the month of June 2020 the Dow Jones Industrial Average increased by 2.16%. And as the calendar tracker shows the Dow had a lot more green days than red trading days during the month of June 2020
So the volatile behaviour of the Dow Jones continues with a mixed bag of up and down days during June 2020. So for the month of June 2020 the Dow Jones Industrial Average increased by 2.16%. And as the calendar tracker shows the Dow had a lot more green days than red trading days during the month of June 2020
Market news and website updates during June 2020
Dow Jones Updates: The Dow Jones ended the day, 30 June 2020 up by 0.85%
Website updates:
So if one had to buy one of these airlines stock right now, which one would it be? Does United Airlines offer the most value as its stock has fallen further than Delta and Southwest over the last 3 years? Or is there an underlying reason why United has underperformed compared to Southwest and Delta? One of our first comparison metrics is the Price to stockholders equity per share ratio. What is the stockholders equity per share? Well if a firm decides to sell all their assets, pay all liabilities and distribute the rest to stockholders that is stockholder equity per share. So expressing that as a ratio to the price one gets a feel of how over/undervalued a stock is. Below the Price to Stockholder Equity per share ratio of the three airlines:
So Southwest Airlines is trading at almost double their stockholders equity per share, Delta about 30% above their stockholders equity per share and United Airlines 7% below their stockholders equity per share. So based on this one would say that United is the cheapest and Southwest the most expensive. Looking at price to earnings ratios wont help much now as they are all current loss making and not generating any earnings to calculate a price to earnings ratio. Cash on the balance sheet is another indication of value and how easily the company can ride out the current tough business environment.
Looking at the cash per share and the percentage it makes up of its current stock price
So again United Airlines comes out on top when looking at the cash per share expressed as a percentage of their stock price. While Southwest has far less cash per share on their balance sheet compared to the other two airlines it is a far smaller airline with a daily cash burn rate that is a lot lower than the two larger airlines. So from a balance sheet perspective they are far better placed to deal with the impact of the Covid-19 pandemic on the air travel industry. And Southwest is far more nibble due to their size to change their operations and business strategy due to the Covid-19 pandemic and its for these reasons we pick Southwest Airlines (LUV) as our Winner in the airline fly off battle
Read the full article here
29 June 2020:
Dow Jones Updates: The Dow Jones ended the day, 29 June 2020 up by -2.32%
Website updates:
In our continued stock battles we pitted two brewers against one another in Constellation Brands (owner of Corona Beer) and Boston Beer Company (owner of Samuel Adams and Dogfish Head). Below an extract from that article.
One of our key metrics is the Price to stockholders equity per share ratio. When looking at this we find the following for both stocks:
Based on this metric Constellation Brands offers far more value than Boston Beer Company. Most firms tend to trade at a ratio of between 2 and 4 times. Boston is trading at well above the expected range and Constellation Brands is trading well within the expected range. The PE ratio of Constellation Brands is 22.1 compared to Boston Beer Company's PE ratio of 61.6
We therefore believe at their respective prices, the stock of Constellation Brands offers far better long term investment value than that of Boston Beer Company. Especially considering the strong stock performance of Boston Beer Company over the last three years. We do feel that Boston Beer Company's stock has run far ahead of its future earnings potential.
Therefore in the battle of the brewers if we have to pick we pick Constellation Brands as our Winner
Read the full article here
26 June 2020: The Dow Jones ended the day, 26 June 2020 down by -2.82%. We do believe the Dow Jones (DJIA) has a lot more downside to come. as its current lofty valuations does not fully take into account the impact of the Covid-19 pandemic on the US economy and economies across the world
Dow Jones Updates
Website Updates
Earlier we covered the latest earnings report of Nike Inc (NKE). Below a short extract from that article
So what do we value one of the worlds biggest clothing and apparel brands stock at following their 4th quarter 2020 earnings report? Based on Nike's latest earnings report for the 4th quarter of their 2020 fiscal year what is our target price (full value price) of Nike Inc. stock?
Based on their latest earnings report our valuation models provides a target price (full value price) for Nike Inc at $58.40 a stock. We therefore believe Nike Inc stock is currently overvalued and we would not recommend long term fundamental and value investors buy into the stock at its current price. We usually suggest looking to buy at least 10% below our target price which in this case is $58.40. We therefore believe a good entry point into the stock of Nike Inc stock is at $52.60 or below.
We expect the stock of Nike to pull back from current levels to levels closer to our target price (full value price) in coming weeks and months. And while the sell off sparked by Coronavirus fears has seen the stock of Nike pull back strongly, we believe the stock has some significant downside risk to it.
Read the full article here
25 June 2020: The Dow Jones ended the day, 25 June 2020 up by 1.18%.
Dow Jones Updates
Website updates
In our continued stock comparison page we had the battle of the Brewers. We compared Boston Beer Company (SAM) against Molson Coors (TAP). Below an extract of that article.
So if one had to buy one of these two brewers now which one is the better buy? Does Molson Coors provide a better buying opportunity due to its stock price declines compared to the sharp increase in the stock price of Boston Beer Company, or is the underlying fundamentals of Boston Beer Company just so much better than that of Molson Coors?
One of our key metrics is the Price to stockholders equity per share ratio. When looking at this we find the following for both stocks:
Based on this metric Molson Coors offers far more value than Boston Beer Company. Most firms tend to trade at a ratio of between 2 and 4 times. Boston is trading at well above the expected range and Molson Coors trading at well below the expected range.
Read the full article here
24 June 2020: The Dow Jones ended the day, 24 June 2020 down by -2.72%
Earlier today we looked at the stock of Mcdonalds and compared it against that of Chipotle in our battle of the quick service restaurants. Below an extract of that article.
So if one had to buy one of these two quick service restaurant brands which one would it be? Which one is most likely to offer superior stock price returns based on their current stock price and their financial results. Chipotle has some stockholders equity, around $60 a stock, this while Mcdonalds is sitting with a stockholders deficit of close to -$9.3 billion. Chipotle has the far higher PE ratio of the two stocks. Mcdonalds dividend yield is also stronger and their stock price has run up far less than that of Chipotle over the last 3 years. Mcdonalds also has a far greater global reach and brand name and therefore if we have to decide between Mcdonalds (MCD) or Chipotle (CMG) now.. We would pick Mcdonalds as our winner.
Read the full article here
22 June 2020: The Dow Jones ended the day, 22 June 2020 up by 0.59%
(9:37ET) The Dow Jones Industrial Average opened up in negative territory and its currently down by -0.7% 8 minutes into the trading day. Also 10 of the 11 major S&P 500 indices are currently in the red
(8: 47 ET) The Dow Jones Industrial Average futures are currently trading up by 0.69%. So while its off the highs reached earlier it's still in positive territory
(3:40 ET) The Dow Jones Industrial Average futures are currently trading up by 0.78%. So it looks like the Dow Jones is heading for a positive open today
We also covered the latest earnings report of Zoom (ZM) and here is short extract of that article. So based on Zoom's latest earnings report and their outlook provided what do we value Zoom stock at? Considering their latest earnings report and the outlook provided our valuation model provides a target price (full value price) of $153 per Zoom stock.
Even so we believe the stock of Zoom is overvalued at its current price of $251.77. We usually recommend that fundamental or long term value investors look to enter a stock at least 10% below our target price (full value price) which in this case is $153. We therefore believe a good entry point into the stock of Zoom would be at $137.70 or below.
Since the stock of Zoom is trading at well above our recommended entry point we rate their stock as a SELL
19 June 2020: The Dow Jones ended the day down by -0.8%
(9:29 ET) The Dow Jones Industrial Average futures are currently trading up by 1.7% just before the open of the trading day
(7:30 ET) The Dow Jones Industrial Average futures are currently trading up by 0.89% two hours before the open of the trading day
(2:18 ET) The Dow Jones Industrial Average futures are currently trading up by 0.79% following two days of modest declines
18 June 2020: The Dow Jones ended the day down -0.15%
(9:36 ET) The Dow opened lower and is currently trading at -0.94% in the red
(06:55 ET) -Dow Futures are currently down by about 0.15% showing the Dow should open up slightly lower today.
17 June 2020: The Dow Jones Industrial Average (DJIA) ended the day, 17 June 2020 down by -0.65%
(13:10 ET) - And back up we go again, as the FED Chair speaks via live webcasts the Dow has entered positive territory again and us now up 0.2%
(10:34 ET) -The DJIA is currently down by -0.4% for the day after opening modestly in the green at the start of the trading day.
(9:30 ET) -Dow Futures are currently up about 0.2% showing the Dow should open up slightly higher today.
Earlier today we looked at Target Corporation in more detail Below a short extract of that article showing a few quick facts about TGT
Read the full More About Target Corporation (TGT) here
16 June 2020: The Dow Jones Industrial Average (DJIA) is up strongly so far today, with it being up 2.6% at the time of writing (12:54 ET)
A stock to watch today and coming days is Tesla (TLSA) with the stock edging ever closer to the $1000 a stock mark. Will it get there?
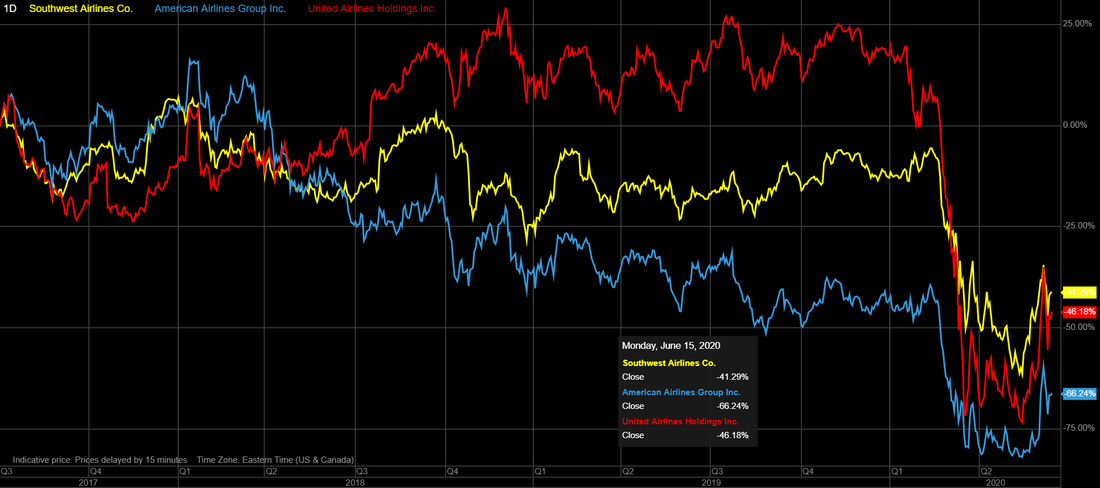
Moving to the airline industry we take a look at three of the biggest airlines in the US and their stock performance over the last 3 years. The image below shows the stock price performance of United Airlines (UAL), American Airlines (AAL) and Southwest Airlines (LUV) over the last 3 years. The stock of United Airlines declined by -46.16% over the last 3 years, while the stock of Southwest declined by -41.29% and American Airlines declined by a significant -66.24% over the three year period.
- (13:15 ET): The Down Jones is currently down by -0.2%
- (10:39 ET): The Dow Jones is currently down by -0.19%
- (4:37 ET): Dow Jones Industrial Average futures are up by 0.19% indicating that the Dow will likely open on a slightly positive note
Website updates:
So if one had to buy one of these airlines stock right now, which one would it be? Does United Airlines offer the most value as its stock has fallen further than Delta and Southwest over the last 3 years? Or is there an underlying reason why United has underperformed compared to Southwest and Delta? One of our first comparison metrics is the Price to stockholders equity per share ratio. What is the stockholders equity per share? Well if a firm decides to sell all their assets, pay all liabilities and distribute the rest to stockholders that is stockholder equity per share. So expressing that as a ratio to the price one gets a feel of how over/undervalued a stock is. Below the Price to Stockholder Equity per share ratio of the three airlines:
- Southwest Airlines: 1.98
- Delta Airlines: 1.27
- United Airlines: 0.93
So Southwest Airlines is trading at almost double their stockholders equity per share, Delta about 30% above their stockholders equity per share and United Airlines 7% below their stockholders equity per share. So based on this one would say that United is the cheapest and Southwest the most expensive. Looking at price to earnings ratios wont help much now as they are all current loss making and not generating any earnings to calculate a price to earnings ratio. Cash on the balance sheet is another indication of value and how easily the company can ride out the current tough business environment.
Looking at the cash per share and the percentage it makes up of its current stock price
- Southwest Airlines: $7.65 (21.8%)
- Delta Airlines: $9.36 (32.7%)
- United Airlines: $13.84 (39.2%)
So again United Airlines comes out on top when looking at the cash per share expressed as a percentage of their stock price. While Southwest has far less cash per share on their balance sheet compared to the other two airlines it is a far smaller airline with a daily cash burn rate that is a lot lower than the two larger airlines. So from a balance sheet perspective they are far better placed to deal with the impact of the Covid-19 pandemic on the air travel industry. And Southwest is far more nibble due to their size to change their operations and business strategy due to the Covid-19 pandemic and its for these reasons we pick Southwest Airlines (LUV) as our Winner in the airline fly off battle
Read the full article here
29 June 2020:
Dow Jones Updates: The Dow Jones ended the day, 29 June 2020 up by -2.32%
- (13:10 ET); Dow Jones Industrial Average is currently trading up by 1.79%
- (10:41 ET): Dow Jones Industrial Average opened in the green and is currently up a strong 1.62%
- (4:05 ET): Dow Jones Industrial Average futures are up by 0.42% indicating that the Dow will likely open on a slightly positive note
Website updates:
In our continued stock battles we pitted two brewers against one another in Constellation Brands (owner of Corona Beer) and Boston Beer Company (owner of Samuel Adams and Dogfish Head). Below an extract from that article.
One of our key metrics is the Price to stockholders equity per share ratio. When looking at this we find the following for both stocks:
- Price/Stockholders equity per share for Boston Beer Company (SAM) : 9.1
- Price/Stockholders equity per share for Constellation Brands (STZ): 2.22
Based on this metric Constellation Brands offers far more value than Boston Beer Company. Most firms tend to trade at a ratio of between 2 and 4 times. Boston is trading at well above the expected range and Constellation Brands is trading well within the expected range. The PE ratio of Constellation Brands is 22.1 compared to Boston Beer Company's PE ratio of 61.6
We therefore believe at their respective prices, the stock of Constellation Brands offers far better long term investment value than that of Boston Beer Company. Especially considering the strong stock performance of Boston Beer Company over the last three years. We do feel that Boston Beer Company's stock has run far ahead of its future earnings potential.
Therefore in the battle of the brewers if we have to pick we pick Constellation Brands as our Winner
Read the full article here
26 June 2020: The Dow Jones ended the day, 26 June 2020 down by -2.82%. We do believe the Dow Jones (DJIA) has a lot more downside to come. as its current lofty valuations does not fully take into account the impact of the Covid-19 pandemic on the US economy and economies across the world
Dow Jones Updates
- (13:35 ET): Dow Jones Industrial Average (DJIA) is currently down strongly by -2.2% with about 2 and a half hours of trading left. So it looks like the Dow Jones will close on a negative note for the 2nd Friday in a row.
- (06:47): Dow Jones futures are currently down by -0.23% indicating a slightly negative open can be expected at the start of the trading day for the Dow Jones
Website Updates
Earlier we covered the latest earnings report of Nike Inc (NKE). Below a short extract from that article
So what do we value one of the worlds biggest clothing and apparel brands stock at following their 4th quarter 2020 earnings report? Based on Nike's latest earnings report for the 4th quarter of their 2020 fiscal year what is our target price (full value price) of Nike Inc. stock?
Based on their latest earnings report our valuation models provides a target price (full value price) for Nike Inc at $58.40 a stock. We therefore believe Nike Inc stock is currently overvalued and we would not recommend long term fundamental and value investors buy into the stock at its current price. We usually suggest looking to buy at least 10% below our target price which in this case is $58.40. We therefore believe a good entry point into the stock of Nike Inc stock is at $52.60 or below.
We expect the stock of Nike to pull back from current levels to levels closer to our target price (full value price) in coming weeks and months. And while the sell off sparked by Coronavirus fears has seen the stock of Nike pull back strongly, we believe the stock has some significant downside risk to it.
Read the full article here
25 June 2020: The Dow Jones ended the day, 25 June 2020 up by 1.18%.
Dow Jones Updates
- (13:38): The Dow Jones Industrial Average is up by 0.30% for the day, as at the time of writing. But we still believe the Dow and rest of the markets is set for significant declines due to the impact of Covid-19. We dont believe current market valuations is taking the full impact of Covid-19 into account.
- (10:11): The Dow Jones Industrial Average has been open for trade for about 40 minutes and its down slightly at -0.12%
- (01:02); The Dow Jones Industrial Average (DJIA) futures are currently down -0.72%. So while the negative trend the Dow ended on yesterday continued today?
Website updates
In our continued stock comparison page we had the battle of the Brewers. We compared Boston Beer Company (SAM) against Molson Coors (TAP). Below an extract of that article.
So if one had to buy one of these two brewers now which one is the better buy? Does Molson Coors provide a better buying opportunity due to its stock price declines compared to the sharp increase in the stock price of Boston Beer Company, or is the underlying fundamentals of Boston Beer Company just so much better than that of Molson Coors?
One of our key metrics is the Price to stockholders equity per share ratio. When looking at this we find the following for both stocks:
- Price/Stockholders equity per share for Boston Beer Company (SAM) : 8.67
- Price/Stockholders equity per share for Molson Coors (TAP) : 0.61
Based on this metric Molson Coors offers far more value than Boston Beer Company. Most firms tend to trade at a ratio of between 2 and 4 times. Boston is trading at well above the expected range and Molson Coors trading at well below the expected range.
Read the full article here
24 June 2020: The Dow Jones ended the day, 24 June 2020 down by -2.72%
- (10:13 ET); The Dow Jones is down significantly in the first 40 minutes of trade today, with the index trading down almost -1.6%
- (03:58 ET): Dow Jones futures are currently down -0.4% so it looks like the US markets are heading for a negative open, and this will be in line with the current negative markets in Europe
Earlier today we looked at the stock of Mcdonalds and compared it against that of Chipotle in our battle of the quick service restaurants. Below an extract of that article.
So if one had to buy one of these two quick service restaurant brands which one would it be? Which one is most likely to offer superior stock price returns based on their current stock price and their financial results. Chipotle has some stockholders equity, around $60 a stock, this while Mcdonalds is sitting with a stockholders deficit of close to -$9.3 billion. Chipotle has the far higher PE ratio of the two stocks. Mcdonalds dividend yield is also stronger and their stock price has run up far less than that of Chipotle over the last 3 years. Mcdonalds also has a far greater global reach and brand name and therefore if we have to decide between Mcdonalds (MCD) or Chipotle (CMG) now.. We would pick Mcdonalds as our winner.
Read the full article here
22 June 2020: The Dow Jones ended the day, 22 June 2020 up by 0.59%
(9:37ET) The Dow Jones Industrial Average opened up in negative territory and its currently down by -0.7% 8 minutes into the trading day. Also 10 of the 11 major S&P 500 indices are currently in the red
(8: 47 ET) The Dow Jones Industrial Average futures are currently trading up by 0.69%. So while its off the highs reached earlier it's still in positive territory
(3:40 ET) The Dow Jones Industrial Average futures are currently trading up by 0.78%. So it looks like the Dow Jones is heading for a positive open today
We also covered the latest earnings report of Zoom (ZM) and here is short extract of that article. So based on Zoom's latest earnings report and their outlook provided what do we value Zoom stock at? Considering their latest earnings report and the outlook provided our valuation model provides a target price (full value price) of $153 per Zoom stock.
Even so we believe the stock of Zoom is overvalued at its current price of $251.77. We usually recommend that fundamental or long term value investors look to enter a stock at least 10% below our target price (full value price) which in this case is $153. We therefore believe a good entry point into the stock of Zoom would be at $137.70 or below.
Since the stock of Zoom is trading at well above our recommended entry point we rate their stock as a SELL
19 June 2020: The Dow Jones ended the day down by -0.8%
(9:29 ET) The Dow Jones Industrial Average futures are currently trading up by 1.7% just before the open of the trading day
(7:30 ET) The Dow Jones Industrial Average futures are currently trading up by 0.89% two hours before the open of the trading day
(2:18 ET) The Dow Jones Industrial Average futures are currently trading up by 0.79% following two days of modest declines
18 June 2020: The Dow Jones ended the day down -0.15%
(9:36 ET) The Dow opened lower and is currently trading at -0.94% in the red
(06:55 ET) -Dow Futures are currently down by about 0.15% showing the Dow should open up slightly lower today.
17 June 2020: The Dow Jones Industrial Average (DJIA) ended the day, 17 June 2020 down by -0.65%
(13:10 ET) - And back up we go again, as the FED Chair speaks via live webcasts the Dow has entered positive territory again and us now up 0.2%
(10:34 ET) -The DJIA is currently down by -0.4% for the day after opening modestly in the green at the start of the trading day.
(9:30 ET) -Dow Futures are currently up about 0.2% showing the Dow should open up slightly higher today.
Earlier today we looked at Target Corporation in more detail Below a short extract of that article showing a few quick facts about TGT
- Target Corporation is listed on the New York Stock Exchange under share code ticker: TGT
- Target Corporation (TGT) market capital: $59.6 billion (as at 17 June 2020)
- Total number of Target outlets: 1,868
- Square footage of all Target outlets: 240 516 000
- Total revenues for Target Corporation during 2019: $78.11 billion
- Total profits for Target Corporation during 2019: $3.281 billion
- Earnings per TGT share in 2019: $6.42
- Dividend per TGT share in 2019: $2.42
- Number of Target Corporation shares outstanding: 515.6 million
- Cash on balance sheet: $2.577 billion
- Stockholders equity: $11.833 billion
- Stockholders equity per share in Target Corporation: $22.94
Read the full More About Target Corporation (TGT) here
16 June 2020: The Dow Jones Industrial Average (DJIA) is up strongly so far today, with it being up 2.6% at the time of writing (12:54 ET)
A stock to watch today and coming days is Tesla (TLSA) with the stock edging ever closer to the $1000 a stock mark. Will it get there?
Moving to the airline industry we take a look at three of the biggest airlines in the US and their stock performance over the last 3 years. The image below shows the stock price performance of United Airlines (UAL), American Airlines (AAL) and Southwest Airlines (LUV) over the last 3 years. The stock of United Airlines declined by -46.16% over the last 3 years, while the stock of Southwest declined by -41.29% and American Airlines declined by a significant -66.24% over the three year period.
15 June 2020: With the Dow futures being overwhelmingly negative to start off the day, the Dow has managed to reverse its early losses and is now trading solidly in the green for the the day. The volatility in world financial markets continue. The sharp reversal of the Dow Jones' fortunes today is due to the Federal Reserve (FED) continued activity in the credit market with it announcing it will buy a broad portfolio of U.S corporate bonds
Earlier today we covered Microsoft (MSFT) as part of our continued "More About" series
Read the full More About Microsoft article here
The Dow Jones Industrial Average (DJIA) ended the day, 15 June 2020 up by 0.62%
12 June 2020: So the DJIA ended the day up by 1.9% after US market indices suffered its biggest declines in 12 weeks yesterday 11 June 2020.
Earlier today in our continued series on "More About" we focused on More about Alphabet (GOOGL), the parent company of Google and YouTube
Read the full article here
11 June 2020: On the 28th of May 2020 we said that something about the Dow Jones Industrial Average (DJIA) performance doesn't add up. And it looks like the market is finally waking up to this, as the Dow saw two days of relatively small declines (just over -1%) yesterday and the day before, but on 11 June 2020 the Dow took a very serious knock with it being down -6.9% for the day so far. Read our warning 28 May 2020 here
We dont believe the sell off is done just yet. We expect the Dow Jones, the Nasdaq and the S&P500 to pull back a lot more, as the full impact of the Covid-19 pandemic has not filtered through all world economies and companies yet.
The Dow Jones (DJIA) declined by a massive -6.9% on 11 June 2020
11 June 2020: In our continued series on "More About" we focused on More about Burlington Stores (BURL). Below a few quick facts about Burlington Stores
Read the full article here
The Dow Jones (DJIA) declined by -1.04% on 10 June 2020
10 June 2020: Yesterday we covered the latest earnings report from Brown-Forman (owner of brands such as Jack Daniels and Woodford Reserve). Below a short extract from that article
Based on the Brown-Forman's 4th quarter 2020 earnings report what do we value the group's stock at? Based on their earnings reported our valuation model prices a target price (full value price) for Brown-Forman stock at $64.20 a stock.
We therefore believe the stock of Brown-Forman is overvalued.
We usually recommend that long term and value investors look to enter a stock at least 10% below our target price (full value price) which in this case is $64.20, a good entry point would therefore be at $57.80 or below. We expect the stock of Brown-Forman to pull back slightly from its current price to levels closer to our target price (full value price) in coming weeks and months.
Read the full article here
The Dow Jones (DJIA) declined by -1.09% on 9 June 2020
9 June 2020: In our continued series on "More About" we focused on More about Kroger Company (KR). Below a few quick facts about Kroger Company
Read the full More About Kroger Company here
The Dow Jones (DJIA) increased sharply by 1.7% on 8 June 2020
7 June 2020: In our continued series on "More About" we focused on More about Royal Caribbean. Below a few quick facts about Royal Caribbean
Read the full More about Royal Caribbean Article here
The Dow Jones increased sharply on Friday with it increasing by 3.15% on 5 June 2020
4 June 2020: The Dow Jones basically closed flat with it increasing by just 0.05% for 4 June 2020
3 June 2020: Yesterday we covered the latest earnings report from Campbell Soup Company. Below an extract from that article
So based on Campbell Soup Company' 3rd quarter 2020 earnings report what do we value Campbell Soup Company's stock at? Based on Campbell Soup Company's latest earnings report and fiscal guidance provided (which they raised) our valuation model provides a target price (full value price) for Campbell's Soup Company stock $46.70 (up from our last valuation of Campbell Soup Company).
We therefore believe the stock of Campbell Soup company is slightly overvalued.
We usually recommend that long term and fundamental investors look to enter a stock at least 10% below our target price, which in this case is $46.70. A good entry point into the stock of Campbell Soup Company would therefore be at $42 or below.
We expect the stock of Campbell's to pull back slightly to levels closer to our target price in coming weeks and months.
Read the full Campbell Soup Company earnings review here
The Dow Jones (DJIA) increased by 2.05% on 3 June 2020
2 June 2020: In our continued series on "More About" we focused on More Shake Shack. Below a few quick facts about Shake Shack
Read the full More About Shake Shack article here
The Dow Jones (DJIA) increased by 1.04% on 2 June 2020
Earlier today we covered Microsoft (MSFT) as part of our continued "More About" series
- Microsoft is listed on the NASDAQ under share code ticker: MSFT
- Microsoft market capital: $1.43 trillion (as at 15 June 2020)
- Number of employees of Microsoft: 144 000
- Revenues in 2019: $125.8 billion
- Earnings per share in 2019: $5.06
- Shares in issue: 7.75 billion
- Dividends paid during 2019: $1.84
- Cash on balance sheet: $11.356 billion
- Stockholders equity: $102.3 billion
- Stockholders equity per share: $13.20
- So Microsoft is trading at 12 times its stockholders equity per share which is well outside the expected range of between 2 and 4 times that most firms tend to trade at
Read the full More About Microsoft article here
The Dow Jones Industrial Average (DJIA) ended the day, 15 June 2020 up by 0.62%
12 June 2020: So the DJIA ended the day up by 1.9% after US market indices suffered its biggest declines in 12 weeks yesterday 11 June 2020.
Earlier today in our continued series on "More About" we focused on More about Alphabet (GOOGL), the parent company of Google and YouTube
- Alphabet is listed on the Nasdaq under share code ticker: GOOGL
- Alphabet market capital: $957.3 billion (as at 12 June 2020)
- Revenues in 2019: $161.857 billion
- Earnings per share in 2019: $49.16
- Shares in issue: 346.342 million
- Cash on balance sheet: $16.7 billion
- Goodwill : $17.888 billion (Goodwill is an indication of the value of brand names etc)
- Stockholders equity per share: $201.422 billion
- Stockholders equity per Alphabet shares: $580
- So Alphabet is trading at 2.4 times its stockholders equity per share
- Average price to book value of firms in the S&P 500 is 3.7
Read the full article here
11 June 2020: On the 28th of May 2020 we said that something about the Dow Jones Industrial Average (DJIA) performance doesn't add up. And it looks like the market is finally waking up to this, as the Dow saw two days of relatively small declines (just over -1%) yesterday and the day before, but on 11 June 2020 the Dow took a very serious knock with it being down -6.9% for the day so far. Read our warning 28 May 2020 here
We dont believe the sell off is done just yet. We expect the Dow Jones, the Nasdaq and the S&P500 to pull back a lot more, as the full impact of the Covid-19 pandemic has not filtered through all world economies and companies yet.
The Dow Jones (DJIA) declined by a massive -6.9% on 11 June 2020
11 June 2020: In our continued series on "More About" we focused on More about Burlington Stores (BURL). Below a few quick facts about Burlington Stores
- Burlington Stores is listed on the New York Stock Exchange under share code ticker: BURL
- Burlington Stores market capital: $14.23 billion (as at 10 June 2020)
- Number of employees of Burlington Stores: 47 000
- Number of stores: 727
- Gross square footage (in thousands) 47,449
- Selling square footage (in thousands) 31,997
- Net sales in fiscal 2019: $7.27 billion
- Earnings per share in fiscal 2019: $6.21
- Shares in issue; 67.3 million
- Stockholders equity in Burlington Stores: $528.149 million
- Stockholders equity per share: $7.84
Read the full article here
The Dow Jones (DJIA) declined by -1.04% on 10 June 2020
10 June 2020: Yesterday we covered the latest earnings report from Brown-Forman (owner of brands such as Jack Daniels and Woodford Reserve). Below a short extract from that article
Based on the Brown-Forman's 4th quarter 2020 earnings report what do we value the group's stock at? Based on their earnings reported our valuation model prices a target price (full value price) for Brown-Forman stock at $64.20 a stock.
We therefore believe the stock of Brown-Forman is overvalued.
We usually recommend that long term and value investors look to enter a stock at least 10% below our target price (full value price) which in this case is $64.20, a good entry point would therefore be at $57.80 or below. We expect the stock of Brown-Forman to pull back slightly from its current price to levels closer to our target price (full value price) in coming weeks and months.
Read the full article here
The Dow Jones (DJIA) declined by -1.09% on 9 June 2020
9 June 2020: In our continued series on "More About" we focused on More about Kroger Company (KR). Below a few quick facts about Kroger Company
- Kroger Company is listed on the New York Stock Exchange under share code ticker: KR
- Number of employees of Kroger Company: 435 000
- Number of Kroger Company stores: 2 757
- 2270 of the stores had pharmacies
- 1567 had fuel centres
- Revenue of Kroger in 2019: $122.2 billion
- Earnings per Kroger share in 2019: $2.04
- Shares in issue: 805 million
- Cash on balance sheet: $399 million
- Stockholders equity in Kroger Company: $8.573 billion
- Stockholders equity per share in Kroger: $10.64
Read the full More About Kroger Company here
The Dow Jones (DJIA) increased sharply by 1.7% on 8 June 2020
7 June 2020: In our continued series on "More About" we focused on More about Royal Caribbean. Below a few quick facts about Royal Caribbean
- Royal Caribbean Cruises is listed on the New York Stock Exchange under share code ticker: RCL
- Together, our Global Brands and our Partner Brands operate a combined total of 61 ship
- Royal Caribbean Cruises had the capacity of approximately 141,570 berths (per year) as of December 31, 2019
- Passengers Carried: 6,553,865
- Passenger Cruise Days: 44,803,953
- Revenues in 2019: $10.95 billion
- Earnings per Royal Caribbean Cruises share in 2019: $8.95
- Dividends per Royal Caribbean Cruises share: $2.96
Read the full More about Royal Caribbean Article here
The Dow Jones increased sharply on Friday with it increasing by 3.15% on 5 June 2020
4 June 2020: The Dow Jones basically closed flat with it increasing by just 0.05% for 4 June 2020
3 June 2020: Yesterday we covered the latest earnings report from Campbell Soup Company. Below an extract from that article
So based on Campbell Soup Company' 3rd quarter 2020 earnings report what do we value Campbell Soup Company's stock at? Based on Campbell Soup Company's latest earnings report and fiscal guidance provided (which they raised) our valuation model provides a target price (full value price) for Campbell's Soup Company stock $46.70 (up from our last valuation of Campbell Soup Company).
We therefore believe the stock of Campbell Soup company is slightly overvalued.
We usually recommend that long term and fundamental investors look to enter a stock at least 10% below our target price, which in this case is $46.70. A good entry point into the stock of Campbell Soup Company would therefore be at $42 or below.
We expect the stock of Campbell's to pull back slightly to levels closer to our target price in coming weeks and months.
Read the full Campbell Soup Company earnings review here
The Dow Jones (DJIA) increased by 2.05% on 3 June 2020
2 June 2020: In our continued series on "More About" we focused on More Shake Shack. Below a few quick facts about Shake Shack
- Shake Shack is listed on the New York Stock Exchange under share code ticker: SHAK
- Shake Shack has 7 603 employees
- Shacks located in the Northeast and the New York City metropolitan area comprises approximately 44% of the total domestic company-operated Shacks as of December 25, 2019
- Shake Shack has 275 outlets
- Of the 275 Shake Shack Outlets 90 is outside the USA
- Shake Shack sales for 2019 fiscal year: $574.625 million
- Earnings per share for fiscal 2019: $0.61
- Shares in issue: 34.422 million
- Cash and equivalents on their balance sheet: $37.099 million
- Stockholders equity in Shake Shack: $321.985 million
Read the full More About Shake Shack article here
The Dow Jones (DJIA) increased by 1.04% on 2 June 2020