|
Related Topics
|
|
Category: Dow Jones Industrial Average (DJIA), Nasdaq and S&P 500
Date: 6 July 2020 We take a look at the performance of the Dow Jones Industrial Average, the Nasdaq and S&P 500 performance over the last 10 years on a interactive chart. And the Nasdaq has easily outperformed the Dow Jones and S&P 500 over the last 10 years. In fact over most time periods it outperformed the Dow and S&P500
|

|
...the Nasdaq has easily outperformed the Dow Jones and the S&P 500 over the last 10 years. "
More About the Dow Jones Industrial Average (DJIA)
The Dow Jones Industrial Average® (The Dow®), is a price-weighted measure of 30 U.S. blue-chip companies. The index covers all industries except transportation and utilities. The market cap of the Dow Jones firms amounts to $7.902 trillion as at end of May 2020. The Dow Jones Industrial Average has a trailing PE ratio of 19.41 and the PE is projected (forward PE) is at 21.66 with a indicated dividend yield of 2.79% and a price to book value of 3.71.
The S&P 500 is widely regarded as the best single gauge of large-cap U.S equities. There is over $9.9 trillion indexed or bench-marked to the index, with the indexed assets comprising approximately $3.4 trillion of this total. The index includes 500 leading companies and covers approximately 80% of the available market capitalization.
The S&P 500 is widely regarded as the best single gauge of large-cap U.S equities. There is over $9.9 trillion indexed or bench-marked to the index, with the indexed assets comprising approximately $3.4 trillion of this total. The index includes 500 leading companies and covers approximately 80% of the available market capitalization.
More About the S&P 500
The S&P 500 is widely regarded as the best single gauge of large-cap U.S equities. There is over $9.9 trillion indexed or bench-marked to the index, with the indexed assets comprising approximately $3.4 trillion of this total. The index includes 500 leading companies and covers approximately 80% of the available market capitalization.
Create in 1957, the S&P 500 was the first U.S market-cap-weighted stock market index. Today, it's the basis of many listed and over the counter investment instruments. The world-renowned index includes 500 of the top companies in leading industries of the U.S economy.
To be included in the S&P 500 companies must have an unadjusted market cap of $8.2 billion or greater of which public float mist be at least $4.1 billion. Currently the PE ratio of the S&P 500 is 22.4 (trailing PE) and is projected to be at 17.1. The indicative dividend yield of the S&P 500 is 2.08% with an average price to book value of 3.34
More About the Nasdaq
Nasdaq is a global electronic marketplace for buying and selling securities. Nasdaq was created by the National Association of Securities Dealers (NASD) to enable investors to trade securities on a computerized, speedy and transparent system, and commenced operations on February 8, 1971. There are currently more than 4000 companies stock listed on the Nasdaq.
Dow Jones Industrial Average vs S&P 500 vs Nasdaq on a chart over the last 10 years
The image below shows the returns provide by the Dow Jones Industrial Average (DJIA), S&P 500 and the Nasdaq over the last 10 years. And as the image shows the Nasdaq has easily outperformed the Dow Jones and the S&P 500 over the last 10 years.
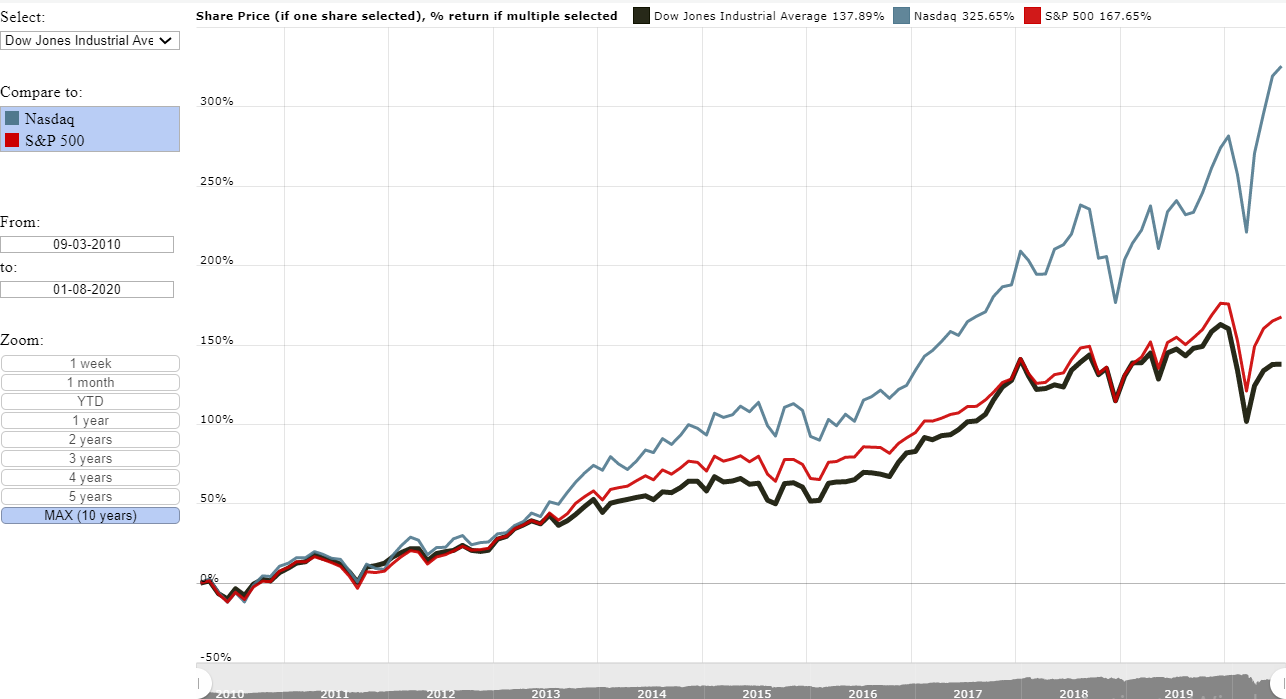
Chart showing the 10 year performance of Dow Jones, S&P 500 and the Nasdaq
The summary below shows the returns of the major US stock market indices (Sorted from best to worst performer)
- Nasdaq: 325.65%
- S&P500: 167.65%
- Dow Jones Industrial Average: 137.89%
Interactive chart of the Dow Jones, Nasdaq and S&P 500
The graphic below shows the performance of the Dow Jones Industrial Average (DJIA) index over the last month. As soon as a user clicks on the Nasdaq or S&P500 the graphic recalculates and shows the returns of the additional indices selected. The graphic will recalculate the returns if users provide their own dates, within the last 10 year (or they can select predefined dates from our Zoom box in the graphic). Data for the graphic obtained from MacroTrends.Net