|
Related Topics
|
|
Category: Stock Market,Dow Jones Industrial Average, S&P 500 and Nasdaq
Last Updated: 22 March 2020 Markets continue sell off due to Coronavirus fears and the US Federal reserve weekend rate cut, which the markets interpreted as a panic move, and with that the markets panicked and the major indices plummeted the most since 1987's Black Monday and last week's Thumping Thursday.
|
|
About the Dow Jones Industrial Average
The Dow Jones Industrial Average® (The Dow®), is a price-weighted measure of 30 U.S. blue-chip companies. The index covers all industries except transportation and utilities. The market cap of the Dow Jones firms amounts to $7.454 trillion. The Dow Jones Industrial Average has a trailing PE ratio of 19.47 and the PE is projected (forward PE) is at 16.24 with a indicated dividend yield of 2.62% and a price to book value of 3.83. The image below provides a breakdown of the sector breakdown of the Dow Jones Industrial Average
About the S&P 500
The S&P 500 is widely regarded as the best single gauge of large-cap U.S equities. There is over $9.9 trillion indexed or bench-marked to the index, with the indexed assets comprising approximately $3.4 trillion of this total. The index includes 500 leading companies and covers approximately 80% of the available market capitalization.
Create in 1957, the S&P 500 was the first U.S market-cap-weighted stock market index. Today, it's the basis of many listed and over the counter investment instruments. The world-renowned index includes 500 of the top companies in leading industries of the U.S economy.
To be included in the S&P 500 companies must have an unadjusted market cap of $8.2 billion or greater of which public float mist be at least $4.1 billion. Currently the PE ratio of the S&P 500 is 22.4 (trailing PE) and is projected to be at 17.1. The indicative dividend yield of the S&P 500 is 2.08% with an average price to book value of 3.34
About the Nasdaq
The Nasdaq Stock Market, also known as Nasdaq, is an American stock exchange located at One Liberty Plaza in New York City. It is ranked second on the list of stock exchanges by market capitalization of shares traded, behind only the New York Stock Exchange. The NASDAQ is an electronic exchange where stocks are traded through an automated network of computers instead of a trading floor. It stands for the National Association of Securities Dealers Automated Quotations System and is the world's second-largest stock exchange based on market capitalization.
22 March 2020: New lows for the Dow Jones, S&P and Nasdaq
On Friday the major indices in the United States set new lows and settled at levels last seen in November 2016. One has to wonder when the market will find its bottom, and how long it will take for the full effect of the Coronavirus pandemic and ensuing lock downs across the world will take to filter through in economic numbers
The summary below shows the performance of the Dow Jones,S&P 500 and the Nasdaq since the start of 2020
The talk in the markets right now revolves around whether the economic and market recovery will be V-shaped, U-shaped or J-shaped. While it is impossible to predict the impact or recovery of the markets from the Coronavirus, one can confidently say it will be swift as billions in liquidity is being pumped into the markets by central banks and fiscal authorities across the world.
Whether a bottom has been found in the markets is yet to be seen, but we doubt it. We expect markets across the world to set lower lows in coming weeks and months and would advise investors against jumping into the markets right now. Rather wait it out and see how this whole saga pans out.
- Nasdaq: -23.33%
- Dow Jones: -32.81%
- S&P 500: -28.66%
The talk in the markets right now revolves around whether the economic and market recovery will be V-shaped, U-shaped or J-shaped. While it is impossible to predict the impact or recovery of the markets from the Coronavirus, one can confidently say it will be swift as billions in liquidity is being pumped into the markets by central banks and fiscal authorities across the world.
Whether a bottom has been found in the markets is yet to be seen, but we doubt it. We expect markets across the world to set lower lows in coming weeks and months and would advise investors against jumping into the markets right now. Rather wait it out and see how this whole saga pans out.
19 March 2020: The whipsaw ride for markets continue
It looks like markets are becoming accustomed to significant declines and spikes over very short periods of time. However in recent weeks declines have outweighed increases and the markets kept making new 52 week lows, only to see a dead cat bounce before the declines continued. The question everyone is asking now is where is the bottom. Or even worse, is there a bottom in sight?
With the full economic and financial impact of the Coronavirus yet to be felt and quantified volatility will continue to increase and be at elevated levels as markets react swiftly to any bit of good or bad news. We would advise investors to sit on the side lines and watch events pan out. There is no need to be actively in the market unless its part of a regular investment strategy in which trades are made with a long term perspective in mind and investors are looking to acquire quality assets at depressed prices. Remember it can always go lower, so if you planning in buying now, be open to the possibility that short to medium term asset prices could continue to decline, and selling then after you bought at depressed prices will be devastating on your future wealth building strategy.
If you have monthly debit orders or calls on your account that invests in |ETF's, unit trusts and the likes, we recommend NOT stopping them. Keep them going as buying now will see the average price paid per ETF or unit trust decline strongly which is good for future earnings on these investments. We remain a fan of the saying "It is not timing the market, but time in the market" that counts.
If you have monthly debit orders or calls on your account that invests in |ETF's, unit trusts and the likes, we recommend NOT stopping them. Keep them going as buying now will see the average price paid per ETF or unit trust decline strongly which is good for future earnings on these investments. We remain a fan of the saying "It is not timing the market, but time in the market" that counts.
17 March 2020: Markets sees biggest sell off since 1987's Black Monday and last week's rout
Yesterday (16 March 2020) the US markets capitulated and had its worst trading session since Black Friday of 1987 and Thumped Thursday of last week. The lastest sell off was triggered by the US Federal reserve cutting US rates to near zero, which is levels last seen during the financial crises. The summary below shows the performance of the Dow Jones,S&P 500 and the Nasdaq for 12 March 2020:
As the saying goes, things will get worse before they get better. And it seems the same applies to global stock markets. Remember its not the end of the world. Markets will go back up again. If you invested for the long term, look to add quality stocks paying good dividends at depressed prices as sell off's such as these do provide excellent buying opportunities to those willing to take the chance by adding or buying when markets are in free fall as it currently is,
- Nasdaq: -12.23%
- Dow Jones: -12.93%
- S&P 500: -11.98%
As the saying goes, things will get worse before they get better. And it seems the same applies to global stock markets. Remember its not the end of the world. Markets will go back up again. If you invested for the long term, look to add quality stocks paying good dividends at depressed prices as sell off's such as these do provide excellent buying opportunities to those willing to take the chance by adding or buying when markets are in free fall as it currently is,
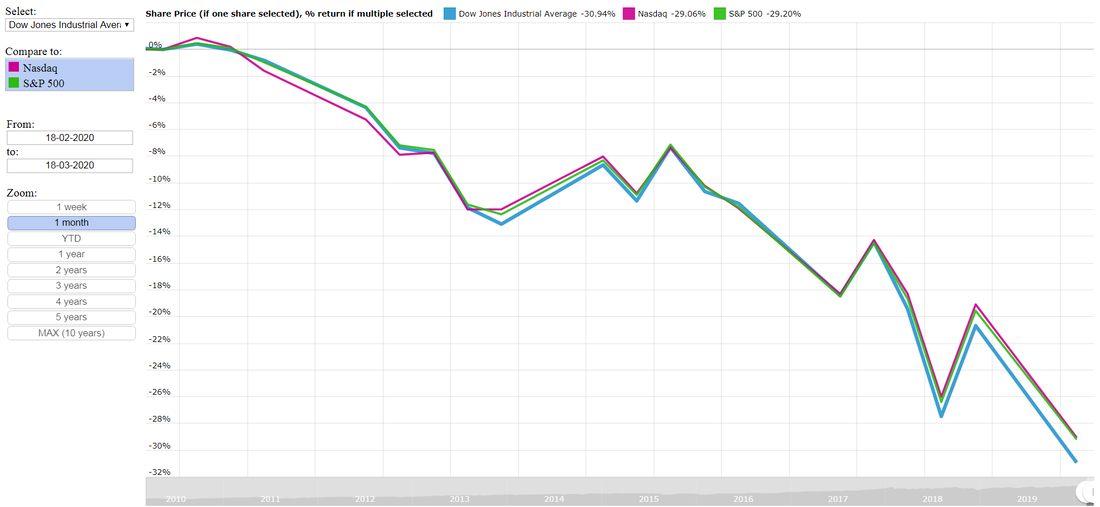
Dow Jones Industrial, S&P 500 and Nasdaq sees worst trading day since 1987's Black Monday.
So as the image above shows its been absolute carnage on the markets in recent weeks. The summary below shows the decline in the Dow Jones Industrial Average, S&P 500 and the Nasdaq over the last month:
- Dow Jones Industrial Average: -30.94%
- Nasdaq: -29.06%
- S&P 500: -29.20%
The image below shows the Dow Jones Industrial Average compared to the Nasdaq and the S&P over the last week. And as it shows its been a bloodbath with all major indices telling very similar story. Over the last 5 trading days (1 full calendar week) the Dow Jones, Nasdaq and S&P 500 provided the following returns (or lack thereof) to investors.
- Dow Jones Industrial Average: -19.30%
- Nasdaq: -17.25%
- S&P 500: -17.21%
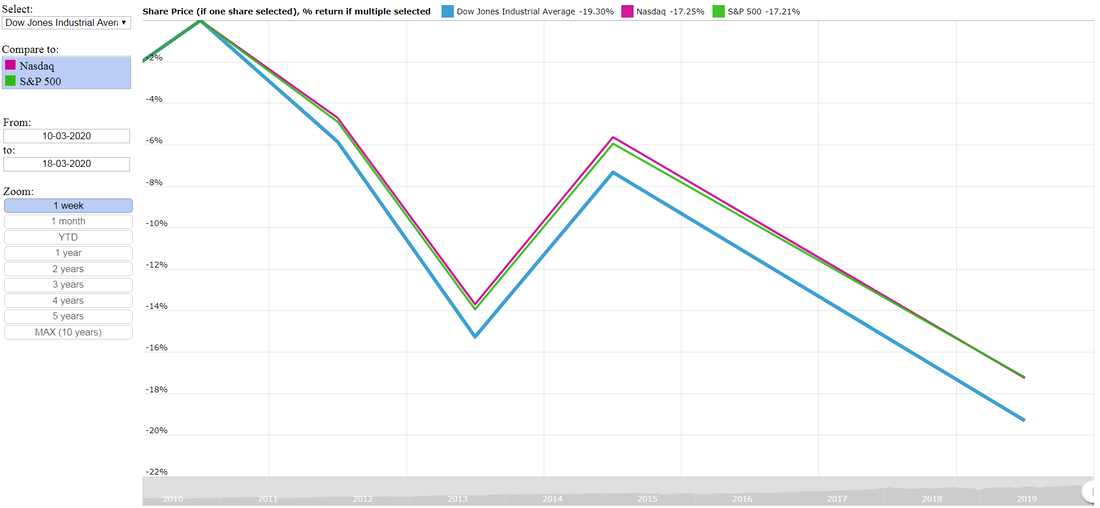
Dow Jones Industrial Average (DJIA) vs S&P 500 vs Nasdaq over the last week
The image below shows the Dow Jones Industrial Average compared to the Nasdaq and the S&P for the year to date (YTD). Basically the returns offered since the start of the year. And as it shows its been a bloodbath with all major indices telling very similar story. The Dow Jones, Nasdaq and S&P 500 provided the following returns to investors from the start of the year.
So the Nasdaq seems to be the most resilient during the current market sell off, with it dropping by less than the other two major indices, but still recording significant declines
- Dow Jones Industrial Average: -29.26%
- Nasdaq: -23.05%
- S&P 500: -26.14%
So the Nasdaq seems to be the most resilient during the current market sell off, with it dropping by less than the other two major indices, but still recording significant declines
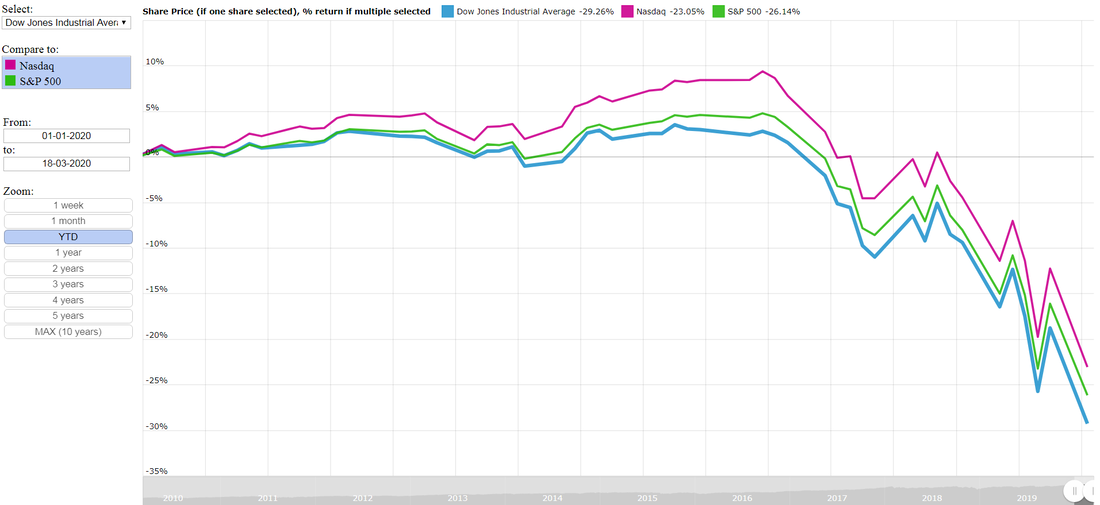
Dow Jones Industrial Average (DJIA) vs S&P 500 vs Nasdaq since the start of 2020
The image below shows the Dow Jones Industrial Average compared to the Nasdaq and the S&P over the last year (12 months). Basically the returns offered from 16 March 2019 to 16 March 2020. And as it shows all gains made during the course of the last year has been erased in a matter of weeks as fear and uncertainty grip the markets. The summary below shows the returns provided over the last 12 months
- Dow Jones Industrial Average: -20.84%
- Nasdaq: -9.66%
- S&P 500: -14.80%

Dow Jones Industrial Average (DJIA) vs S&P 500 vs Nasdaq over the last year
The old saying goes that the markets are only ever driven by two emotions, fear and greed. And currently its gripped with fear and investors are heading for the exits faster than a Ferrari can go around a corner, but there is another saying that goes "be greedy when others are fearful, be fearful when others are greedy". Sharp declines like these will always create opportunities for investors to get into good quality assets at discounted prices. But as with most things in life, it comes at a price, and the price is the risk of losing more money before markets turn around. At the end of the day one has to look at the underlying long term fundamentals of the markets and particular stocks, and if their futures still looks good and prospects going into the future looks good then one has to see this as buying opportunity that is presenting itself