
|
Related Topics
|
|
Category: Stock Market,Dow Jones Industrial Average, S&P 500 and Nasdaq
Date: 12 March 2020 Markets continue sell off due to Coronavirus fears and the US response to the Coronavirus, in which it plans to implement a travel ban from Europe. There as been nowhere for investors to hide as the bears rule the stock market floors. We take a look at how the Dow Jones has performed compared to the S&P 500 and the Nasdaq over recent weeks as well as over the last 10 years.
|

|
About the Dow Jones Industrial Average
The Dow Jones Industrial Average® (The Dow®), is a price-weighted measure of 30 U.S. blue-chip companies. The index covers all industries except transportation and utilities. The market cap of the Dow Jones firms amounts to $7.454 trillion. The Dow Jones Industrial Average has a trailing PE ratio of 19.47 and the PE is projected (forward PE) is at 16.24 with a indicated dividend yield of 2.62% and a price to book value of 3.83. The image below provides a breakdown of the sector breakdown of the Dow Jones Industrial Average
About the S&P 500
The S&P 500 is widely regarded as the best single gauge of large-cap U.S equities. There is over $9.9 trillion indexed or bench-marked to the index, with the indexed assets comprising approximately $3.4 trillion of this total. The index includes 500 leading companies and covers approximately 80% of the available market capitalization.
Create in 1957, the S&P 500 was the first U.S market-cap-weighted stock market index. Today, it's the basis of many listed and over the counter investment instruments. The world-renowned index includes 500 of the top companies in leading industries of the U.S economy.
To be included in the S&P 500 companies must have an unadjusted market cap of $8.2 billion or greater of which public float mist be at least $4.1 billion. Currently the PE ratio of the S&P 500 is 22.4 (trailing PE) and is projected to be at 17.1. The indicative dividend yield of the S&P 500 is 2.08% with an average price to book value of 3.34
About the Nasdaq
The Nasdaq Stock Market, also known as Nasdaq, is an American stock exchange located at One Liberty Plaza in New York City. It is ranked second on the list of stock exchanges by market capitalization of shares traded, behind only the New York Stock Exchange. The NASDAQ is an electronic exchange where stocks are traded through an automated network of computers instead of a trading floor. It stands for the National Association of Securities Dealers Automated Quotations System and is the world's second-largest stock exchange based on market capitalization.
13 March 2020: Update on biggest market sell off since 1987
Last night (12 March 2020) the US markets capitulated and had its worst trading session since 1987. It looked like a repeat of Black Monday. We will call it Thumped Thursday. The summary below shows the performance of the Dow Jones,S&P 500 and the Nasdaq for 12 March 2020:
This latest stock market route has written off trillions of US dollars of market capital across the globe with little to no end in sight as the Indian Stock Exchange and the most quoted index the Nifty 50 plunged more than 10% in today's (13 March 2020) trade and triggered a circuit breaker which halted trade temporarily.
As the saying goes, things will get worse before they get better. And it seems the same applies to global stock markets. Remember its not the end of the world. Markets will go back up again. If you invested for the long term, look to add quality stocks paying good dividends at depressed prices as sell off's such as these do provide excellent buying opportunities to those willing to take the chance by adding or buying when markets are in free fall as it currently is,
- Nasdaq: -9.43%
- Dow Jones: -9.99%
- S&P 500: -9.51%
This latest stock market route has written off trillions of US dollars of market capital across the globe with little to no end in sight as the Indian Stock Exchange and the most quoted index the Nifty 50 plunged more than 10% in today's (13 March 2020) trade and triggered a circuit breaker which halted trade temporarily.
As the saying goes, things will get worse before they get better. And it seems the same applies to global stock markets. Remember its not the end of the world. Markets will go back up again. If you invested for the long term, look to add quality stocks paying good dividends at depressed prices as sell off's such as these do provide excellent buying opportunities to those willing to take the chance by adding or buying when markets are in free fall as it currently is,
Dow Jones Industrial, S&P 500 and Nasdaq sees worst trading day since 1987's Black Monday.
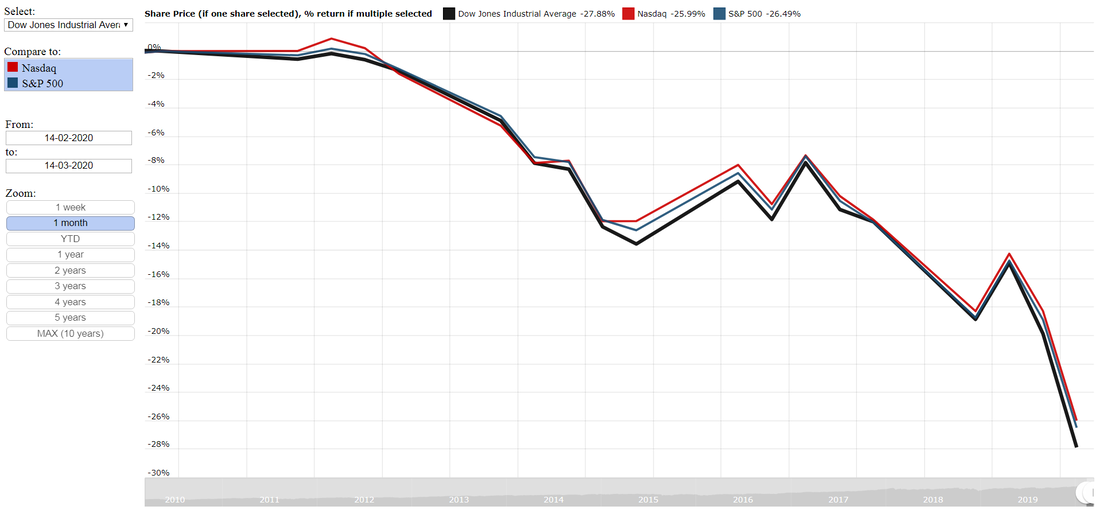
So as the image above shows its been absolute carnage on the markets in recent weeks. The summary below shows the decline in the Dow Jones Industrial Average, S&P 500 and the Nasdaq over the last month:
- Dow Jones Industrial Average: -27.88%
- Nasdaq: -25.99%
- S&P 500: -26.49%
12 March 2020: Coronavirus fears and the United States response sends markets into free fall.. again.
So a lack of detailed information about the planned stimulus to be provided by the United States government to counter the economic effects of the Coronavirus and the new travel ban to be implemented by the USA against Europe (except the UK) to try and curb new infections entering the country sent market participants and investors running for the hills and it sparked a fresh new sell off in world markets. On the 11th of March 2020 the Nasdaq ended the day down by -4.7%, the Dow Jones ended the day down -5.86% and the S&P 500 declined by -4.89%.
So with the massive decline in the markets over the last coupe of weeks and days how has some of the major indices quoted and looked at by market analysts and commentators performed looking at slightly longer time periods? The interactive graphic below shows the returns of the Dow Jones over the last month. As soon as a user clicks on either the S&P or Nasdaq the graphic calculates the returns provided by the indices selected by the user for the particular time period provided by the user. Users can add their own time frames (within the last 10 years) or use one of the predefined dates under the zoom heading.
Note data was obtained from Macrotrends.net
The image below shows the Dow Jones Industrial Average compared to the Nasdaq and the S&P over the last week. And as it shows its been a bloodbath with all major indices telling very similar story. Over the last 5 trading days (1 full calendar week) the Dow Jones, Nasdaq and S&P 500 provided the following returns (or lack thereof) to investors.
- Dow Jones Industrial Average: -9.83%
- Nasdaq: -9%
- S&P 500: -9.34%
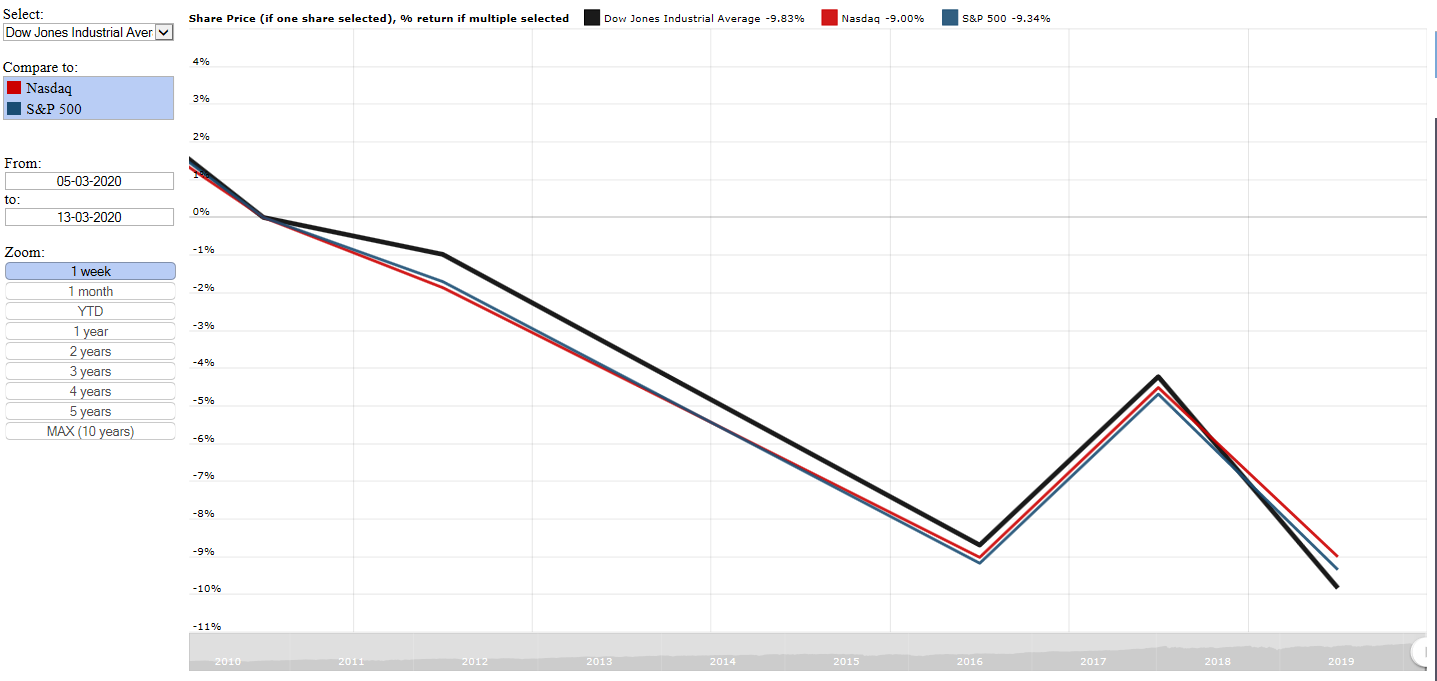
Dow Jones Industrial Average (DJIA) vs S&P 500 vs Nasdaq over the last week
The image below shows the Dow Jones Industrial Average compared to the Nasdaq and the S&P for the year to date (YTD). Basically the returns offered since the start of the year. And as it shows its been a bloodbath with all major indices telling very similar story. The Dow Jones, Nasdaq and S&P 500 provided the following returns to investors from the start of the year.
So the Nasdaq seems to be the most resilient during the current market sell off, with it dropping by less than the other two major indices, but still recording significant declines
- Dow Jones Industrial Average: -17.47%
- Nasdaq: -11.37%
- S&P 500: -15.15%
So the Nasdaq seems to be the most resilient during the current market sell off, with it dropping by less than the other two major indices, but still recording significant declines
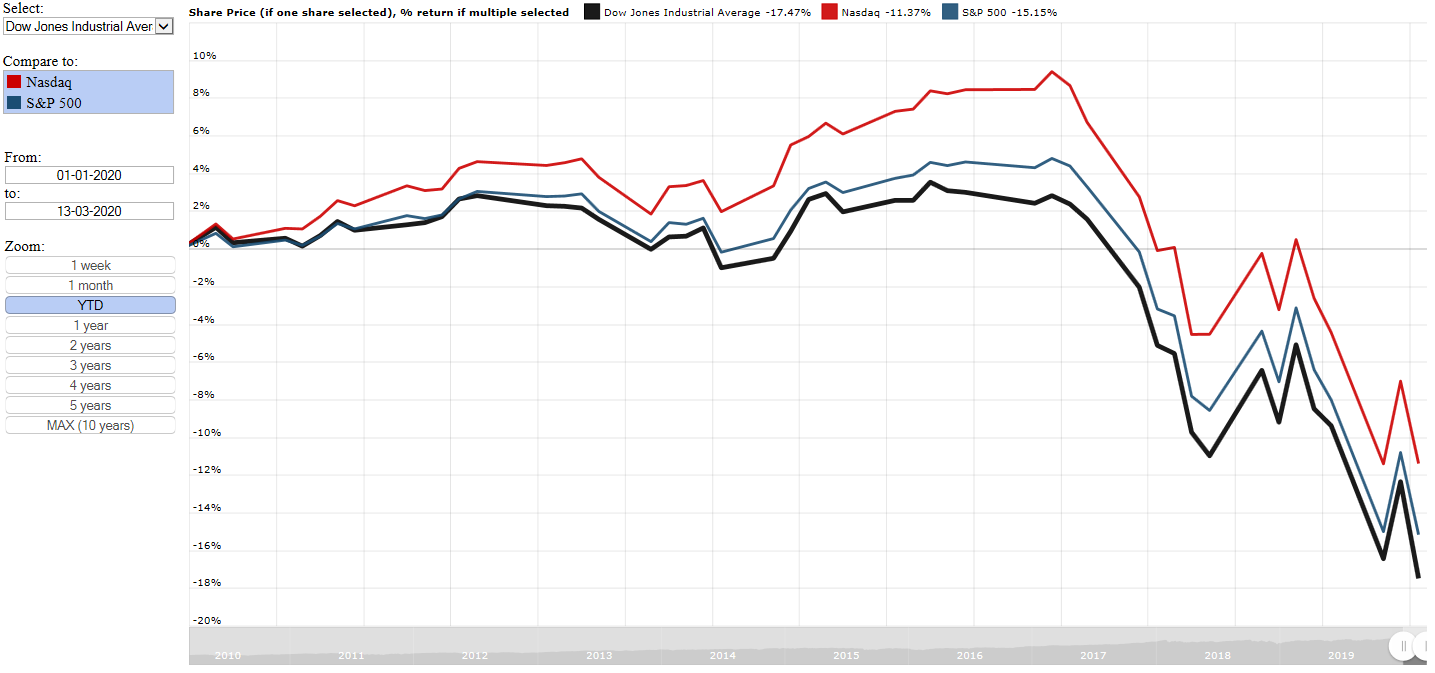
Dow Jones Industrial Average (DJIA) vs S&P 500 vs Nasdaq since the start of 2020
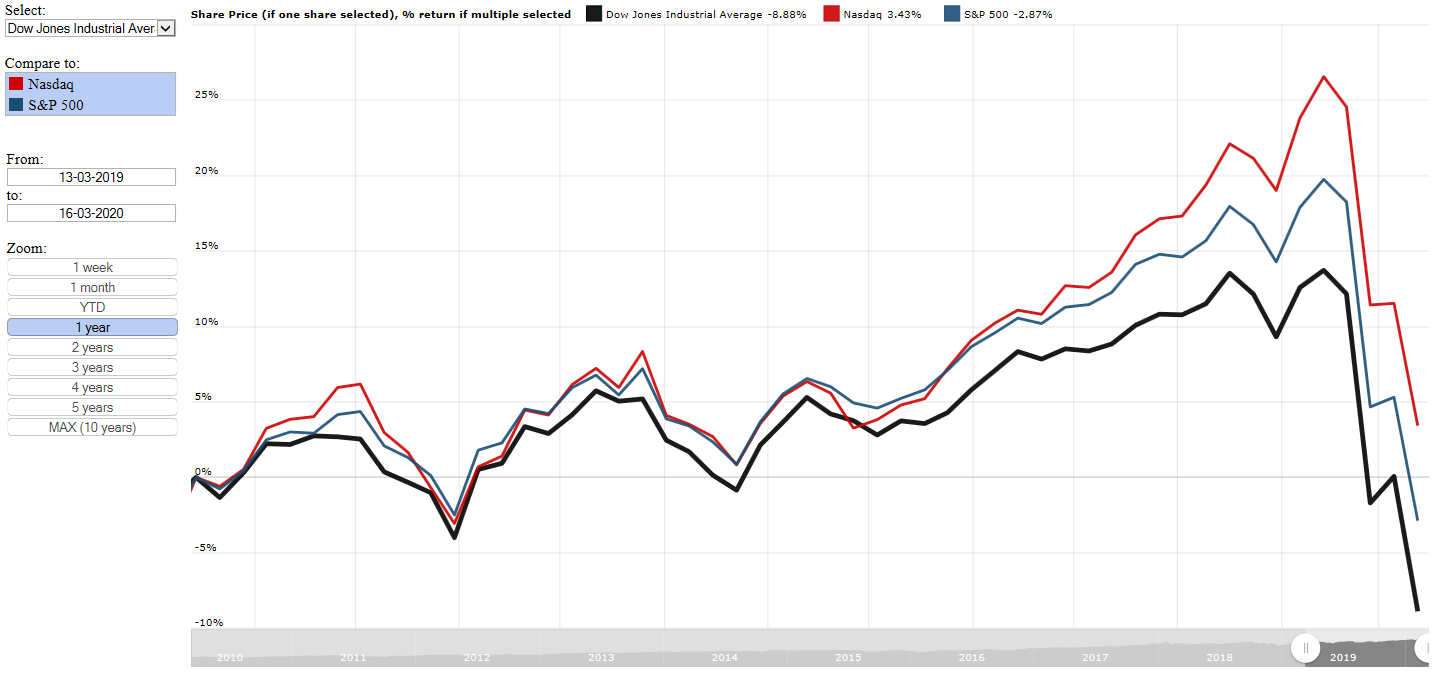
The image below shows the Dow Jones Industrial Average compared to the Nasdaq and the S&P over the last year (12 months). Basically the returns offered from 11 March 2019 to11 March 2020. And as it shows all gains made during the course of the last year has been erased in a matter of weeks as fear and uncertainty grip the markets. The summary below shows the returns provided over the last 12 months
- Dow Jones Industrial Average: -8.88%
- Nasdaq: 3.43%
- S&P 500: -2.87%
The old saying goes that the markets are only ever driven by two emotions, fear and greed. And currently its gripped with fear and investors are heading for the exits faster than a Ferrari can go around a corner, but there is another saying that goes "be greedy when others are fearful, be fearful when others are greedy". Sharp declines like these will always create opportunities for investors to get into good quality assets at discounted prices. But as with most things in life, it comes at a price, and the price is the risk of losing more money before markets turn around. At the end of the day one has to look at the underlying long term fundamentals of the markets and particular stocks, and if their futures still looks good and prospects going into the future looks good then one has to see this as buying opportunity that is presenting itself