|
Related Topics
|
|
Category: Stock Market,Dow Jones Industrial Average, S&P 500 and Nasdaq
Last Updated: 25 March 2020 Yesterday USA's major indices surged on hopes of a stimulus package to soften the economic impact of the Coronavirus on the US economy. The Dow Jones had its single biggest jump in a trading day since 1933. We take a look at the performance of the Dow, Nasdaq and S&P over the last 10 years.
|
|
About the Dow Jones Industrial Average
The Dow Jones Industrial Average® (The Dow®), is a price-weighted measure of 30 U.S. blue-chip companies. The index covers all industries except transportation and utilities. The market cap of the Dow Jones firms amounts to $7.454 trillion. The Dow Jones Industrial Average has a trailing PE ratio of 19.47 and the PE is projected (forward PE) is at 16.24 with a indicated dividend yield of 2.62% and a price to book value of 3.83. The image below provides a breakdown of the sector breakdown of the Dow Jones Industrial Average
About the S&P 500
The S&P 500 is widely regarded as the best single gauge of large-cap U.S equities. There is over $9.9 trillion indexed or bench-marked to the index, with the indexed assets comprising approximately $3.4 trillion of this total. The index includes 500 leading companies and covers approximately 80% of the available market capitalization.
Create in 1957, the S&P 500 was the first U.S market-cap-weighted stock market index. Today, it's the basis of many listed and over the counter investment instruments. The world-renowned index includes 500 of the top companies in leading industries of the U.S economy.
To be included in the S&P 500 companies must have an unadjusted market cap of $8.2 billion or greater of which public float mist be at least $4.1 billion. Currently the PE ratio of the S&P 500 is 22.4 (trailing PE) and is projected to be at 17.1. The indicative dividend yield of the S&P 500 is 2.08% with an average price to book value of 3.34
About the Nasdaq
The Nasdaq Stock Market, also known as Nasdaq, is an American stock exchange located at One Liberty Plaza in New York City. It is ranked second on the list of stock exchanges by market capitalization of shares traded, behind only the New York Stock Exchange. The NASDAQ is an electronic exchange where stocks are traded through an automated network of computers instead of a trading floor. It stands for the National Association of Securities Dealers Automated Quotations System and is the world's second-largest stock exchange based on market capitalization.
25 March 2020: Massive surge for the Dow Jones, S&P and Nasdaq
Yesterday the major US indices surged as the hopes and expectations of a stimulus package for the US economy increased. The summary below shows the returns of the major indices yesterday (24 March 2020):
Bloomberg reported the following after yesterday's trading day.
U.S. stocks had the best day in almost a dozen years as investors rediscovered their appetite for risk with Congress closing in on an unprecedented spending bill to prop up the slumping economy. The dollar halted a 10-day winning streak.
The S&P 500 rebounded from the lowest level since 2016, notching a third straight Tuesday turnaround -- and the biggest one-day gain since October 2008 -- after starting the week with a rout. The Dow Jones Industrial Average rose more than 11% to clock its biggest advance since 1933. Lawmakers are negotiating the final sticking points in a roughly $2 trillionstimulus bill to help the U.S. economy get through the coronavirus pandemic, and House Speaker Nancy Pelosi said she was hopeful a deal could be reached today.
“U.S. equities are responding to the possibility of this gargantuan fiscal stimulus package and some certainty in the political situation,” Stephen Dover, head of equities at Franklin Templeton, said in a phone interview. The Stoxx Europe 600 Index also surged, led by health-care and industrial companies, even as data began to show the extent of economic damage to the region from the coronavirus pandemic. Benchmarks across Asia jumped, with Korea’s index soaring almost 9% after the government announced measures to stabilize markets.
Read the full article from Bloomberg here
The interactive graphic below shows the index level of the Dow Jones over the last month. As soon as a reader clicks on the Nasdaq or S&P the graphic recalculates and provides the return of the selected indices for the last month. Readers can enter their own dates (within the last 10 years) or select dates from our predetermined list under the Zoom heading. As soon as a new date is entered the graphic recalculates the returns of selected indices for the dates entered or requested.
- Dow Jones: 11.37%
- Nasdaq: 8.12%
- S&P 500: 9.38%
Bloomberg reported the following after yesterday's trading day.
U.S. stocks had the best day in almost a dozen years as investors rediscovered their appetite for risk with Congress closing in on an unprecedented spending bill to prop up the slumping economy. The dollar halted a 10-day winning streak.
The S&P 500 rebounded from the lowest level since 2016, notching a third straight Tuesday turnaround -- and the biggest one-day gain since October 2008 -- after starting the week with a rout. The Dow Jones Industrial Average rose more than 11% to clock its biggest advance since 1933. Lawmakers are negotiating the final sticking points in a roughly $2 trillionstimulus bill to help the U.S. economy get through the coronavirus pandemic, and House Speaker Nancy Pelosi said she was hopeful a deal could be reached today.
“U.S. equities are responding to the possibility of this gargantuan fiscal stimulus package and some certainty in the political situation,” Stephen Dover, head of equities at Franklin Templeton, said in a phone interview. The Stoxx Europe 600 Index also surged, led by health-care and industrial companies, even as data began to show the extent of economic damage to the region from the coronavirus pandemic. Benchmarks across Asia jumped, with Korea’s index soaring almost 9% after the government announced measures to stabilize markets.
Read the full article from Bloomberg here
The interactive graphic below shows the index level of the Dow Jones over the last month. As soon as a reader clicks on the Nasdaq or S&P the graphic recalculates and provides the return of the selected indices for the last month. Readers can enter their own dates (within the last 10 years) or select dates from our predetermined list under the Zoom heading. As soon as a new date is entered the graphic recalculates the returns of selected indices for the dates entered or requested.
The summary below shows the performance of the Dow Jones,S&P 500 and the Nasdaq since the start of 2020
The talk in the markets right now revolves around whether the economic and market recovery will be V-shaped, U-shaped or J-shaped. While it is impossible to predict the impact or recovery of the markets from the Coronavirus, one can confidently say it will be swift as billions in liquidity is being pumped into the markets by central banks and fiscal authorities across the world.
Whether a bottom has been found in the markets is yet to be seen, but we doubt it. We expect markets across the world to set lower lows in coming weeks and months and would advise investors against jumping into the markets right now. Rather wait it out and see how this whole saga pans out.
- Nasdaq: -17.33%
- Dow Jones: -27.45%
- S&P 500: -24.25%
The talk in the markets right now revolves around whether the economic and market recovery will be V-shaped, U-shaped or J-shaped. While it is impossible to predict the impact or recovery of the markets from the Coronavirus, one can confidently say it will be swift as billions in liquidity is being pumped into the markets by central banks and fiscal authorities across the world.
Whether a bottom has been found in the markets is yet to be seen, but we doubt it. We expect markets across the world to set lower lows in coming weeks and months and would advise investors against jumping into the markets right now. Rather wait it out and see how this whole saga pans out.
It looks like markets are becoming accustomed to significant declines and spikes over very short periods of time. However in recent weeks declines have outweighed increases and the markets kept making new 52 week lows, only to see a dead cat bounce before the declines continued. The question everyone is asking now is where is the bottom. Or even worse, is there a bottom in sight? The massive spike in markets yesterday makes on wonder if a bottom has been reached? The image below shows the returns of the Dow Jones, Nasdaq and S&P 500 over the last week (5 trading days). And for once we can report that the returns are positive.

Massive surge in the returns of Dow Jones, Nasdaq and S&P 500 yesterday (24 March 2020)
With the full economic and financial impact of the Coronavirus yet to be felt and quantified volatility will continue to increase and be at elevated levels as markets react swiftly to any bit of good or bad news. We would advise investors to sit on the side lines and watch events pan out. There is no need to be actively in the market unless its part of a regular investment strategy in which trades are made with a long term perspective in mind and investors are looking to acquire quality assets at depressed prices. Remember it can always go lower, so if you planning in buying now, be open to the possibility that short to medium term asset prices could continue to decline, and selling then after you bought at depressed prices will be devastating on your future wealth building strategy.
If you have monthly debit orders or calls on your account that invests in ETF's, unit trusts and the likes, we recommend NOT stopping them. Keep them going as buying now will see the average price paid per ETF or unit trust decline strongly which is good for future earnings on these investments. We remain a fan of the saying "It is not timing the market, but time in the market" that counts.
If you have monthly debit orders or calls on your account that invests in ETF's, unit trusts and the likes, we recommend NOT stopping them. Keep them going as buying now will see the average price paid per ETF or unit trust decline strongly which is good for future earnings on these investments. We remain a fan of the saying "It is not timing the market, but time in the market" that counts.
The image below shows the Dow Jones Industrial Average compared to the Nasdaq and the S&P for the year to date (YTD). Basically the returns offered since the start of the year. And as it shows its been a bloodbath with all major indices telling very similar story. The Dow Jones, Nasdaq and S&P 500 provided the following returns to investors from the start of the year.
So the Nasdaq seems to be the most resilient during the current market sell off, with it dropping by less than the other two major indices, but still recording significant declines
- Dow Jones Industrial Average: -27.45%
- Nasdaq: -17.33%
- S&P 500: -24.25%
So the Nasdaq seems to be the most resilient during the current market sell off, with it dropping by less than the other two major indices, but still recording significant declines

Dow Jones Industrial Average (DJIA) vs S&P 500 vs Nasdaq since the start of 2020
The image below shows the Dow Jones Industrial Average compared to the Nasdaq and the S&P over the last year (12 months). Basically the returns offered from 24 March 2019 to 24 March 2020. And as it shows all gains made during the course of the last year has been erased in a matter of weeks as fear and uncertainty grip the markets. The summary below shows the returns provided over the last 12 months
- Dow Jones Industrial Average: -20.15%
- Nasdaq: -4.03%
- S&P 500: -13.66%
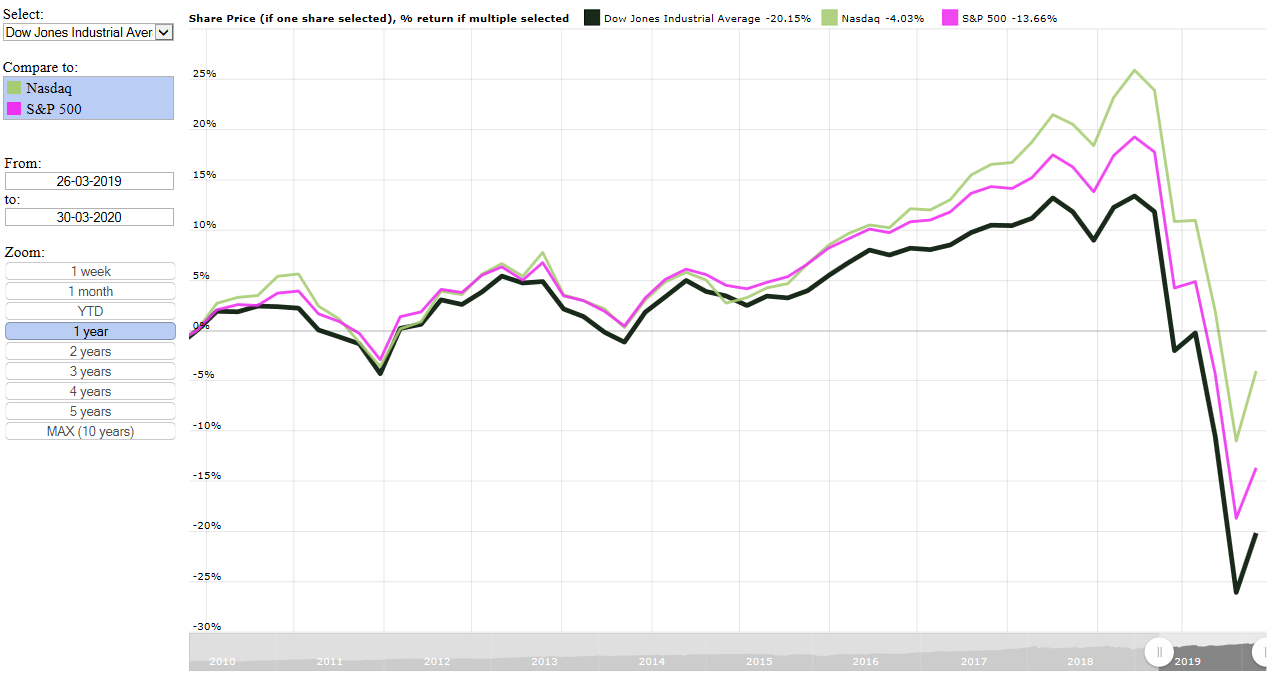
Dow Jones Industrial Average (DJIA) vs S&P 500 vs Nasdaq over the last year
The old saying goes that the markets are only ever driven by two emotions, fear and greed. And currently its gripped with fear and investors are heading for the exits faster than a Ferrari can go around a corner, but there is another saying that goes "be greedy when others are fearful, be fearful when others are greedy". Sharp declines like these will always create opportunities for investors to get into good quality assets at discounted prices. But as with most things in life, it comes at a price, and the price is the risk of losing more money before markets turn around. At the end of the day one has to look at the underlying long term fundamentals of the markets and particular stocks, and if their futures still looks good and prospects going into the future looks good then one has to see this as buying opportunity that is presenting itself