|
Related Topics
|
|
Category: Dow Jones, Nasdaq and S&P500
Date: 11 July 2020 We take a look at the performance of the Dow Jones, Nasdaq and S&P500 for the week ending 10 July 2020. The week was dominated by a sharp increase in coronavirus cases in the United States with various states reaching new all time high daily infection rates. Markets are pretty volatile and during the last week its seen a few up and down days but all major indices closed in the green for the week.
|

|
Warren Buffett the world's best known investor said, be greedy when others are fearful, be fearful when others are greedy. Basically sell offs providing buying opportunities for savvy investors. Note buying opportunities. Not selling opportunities."
Dow Jones, Nasdaq and S&P 500 all recorded modest increases for the week ending 10 July 2020
The image below shows the returns of the Dow Jones (DJIA), Nasdaq and S&P 500 over the last week (6 July 2020 to 10 July 2020). As the graphic shows all three major US market indices recorded moderate increases for the week ending 10 July 2020
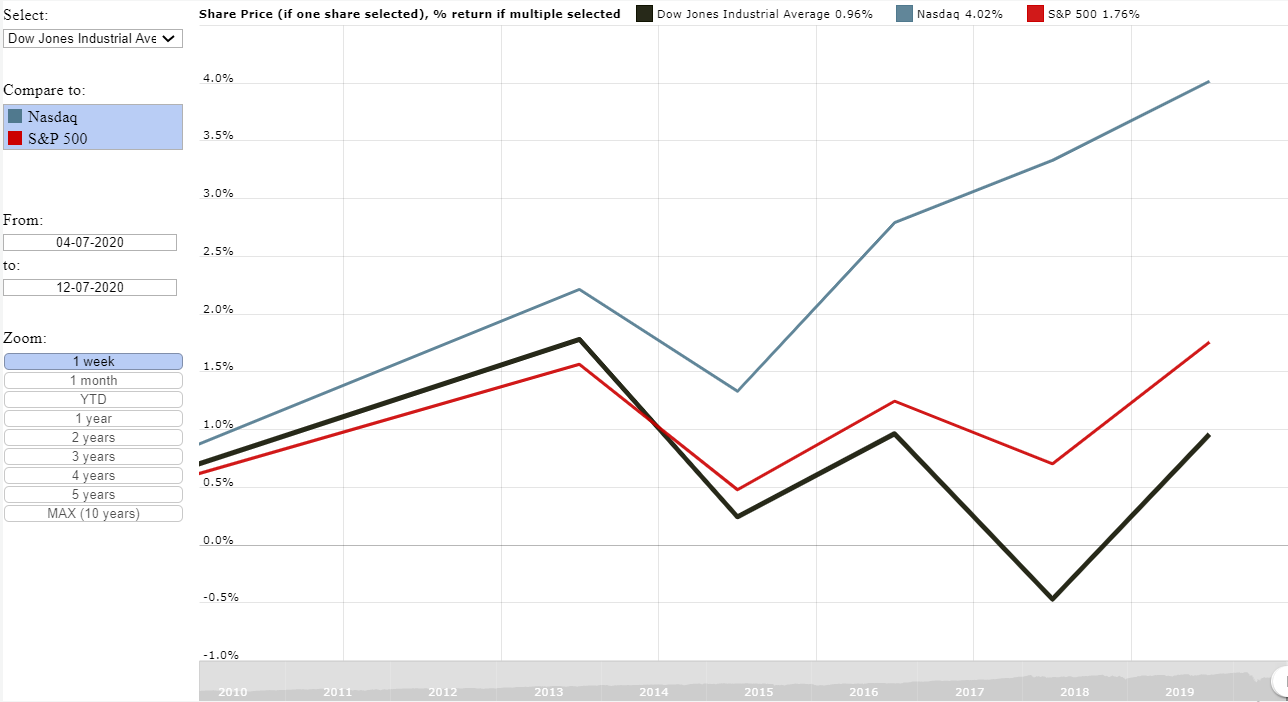
Graph of The Dow Jones, Nasdaq and S&P 500 performance for the week ending 10 July 2020
Below the returns of the main market indices over the last week, 6 July 2020 to 10 July 2020 (sorted from best performer to worst performer)
We are surprised at the current strength of the financial markets considering the fact that there is an alarming spike in the number of coronavirus cases in the the United States. This will have a negative impact on businesses, consumers and the health care sector in general. We cannot see why markets are so positive at this point in time. We do expect that another sharp sell off is in the market's short term future.
- Nasdaq: 4.02%
- S&P 500: 1.76%
- Dow Jones: 0.96%
We are surprised at the current strength of the financial markets considering the fact that there is an alarming spike in the number of coronavirus cases in the the United States. This will have a negative impact on businesses, consumers and the health care sector in general. We cannot see why markets are so positive at this point in time. We do expect that another sharp sell off is in the market's short term future.
So lets take a look at some of the major market events during the last week
10 July 2020: The Dow Jones ended the day 10 July up by 1.44%
Dow Jones Updates:
Website Updates:
We covered the latest earnings report from Helen of Troy, owner of brands such as OXO, Braun and Hydro Flask
So what is Helen of Troy's stock worth based on the release of their latest earnings report? Based on the group's latest earnings and their outlook provided our valuation model provides a target (full value) price at $174.10 a Helen of Troy stock. We therefore believe that the stock of Helen of Troy is overvalued.
We usually suggest long term fundamental or value investors look to enter into a stock at least 10% below our target (full value) price which in this case is $174.10. Thus we see a good entry point into Helen of Troy's stock at $156.70 or below. We believe that Helen of Troy's stock will pull back in coming weeks and months to levels closer to our target price (full value price).
Since the stock of Helen of Troy (HELE) is trading at well above our suggested entry point we rate the stock of HELE as a sell
Read the full article here
9 July 2020: The Dow Jones ended the 9th of July down by -1.39%
Dow Jones Updates:
Website Updates:
We covered the latest earnings report of Urban Outfitters. A clothing and apparel brand with operations in the USA and Europe
So what is Bed Bath and Beyond (NASDAQ: BBBY) stock worth based on the release of their latest earnings report? It is always hard to value a loss making company, and we either use cash generated per share as a proxy for earnings or our standard fall back position is using the stockholders equity per share as a base valuation. We therefore value Bed Bath and Beyond at $11.81 a stock. We therefore believe that the stock is undervalued.
We usually suggest long term investors look to enter a stock at least 10% below our target (full value) price which in this case is $11.81. So a good entry point into Bed Bath and Beyond's stock would be at $10.62 or below. Since the stock of Bed Bath and Beyond is trading close to our suggested entry point we rate the stock of BBBY as a Hold
Read the full article
8 July 2020:
Dow Jones Updates:
Website Updates:
We covered the latest earnings report of Urban Outfitters. A clothing and apparel brand with operations in the USA and Europe
So what is Urban Outfitters stock worth based on their 1st quarter 2021 earnings report? Based on Urban Outfitters latest earnings report our valuation model provides a target price (full value price) for Urban Outfitters at $26.40 a stock. We therefore believe the stock of Urban Outfitters is undervalued
We usually recommend long term fundamental or value investors look to enter a stock at least 10% below our target price (full value price), which in this case is $26.40, thus a good entry point into Urban Outfitters would be at $23.80 or below.
We expect the stock of Urban Outfitters to recover from the significant drop in its stock price due to the Covid-19 pandemic as states and economies across the world starts opening up again following Covid related lockdowns and stay at home orders.
Read the full article
7 July 2020:
Dow Jones Updates: The Dow Jones ended the 6th of July down by -1.51%
Website Updates:
So what is D.R Horton (NYSE:DHI) stock worth based on the release of their latest earnings report and the fiscal guidance provided for their 2020 fiscal year? Based on the earnings reported and the guidance provided our valuation model provides a target (full value) price for D.R Horton at $73.20 a stock (up slightly from our 1st quarter 2020 earnings report valuation of D.R Horton). We therefore believe that the stock is undervalued.
We usually suggest long term fundamental or value investors look to enter a stock at least 10% below our target (full value) price which in this case is $73.20. A good entry point into D.R Horton would therefore be at $65.90 or below. Since the stock of D.R Horton is trading at well below our suggested entry point into the group's stock we rate the stock of D.R Horton as a buy
Read the full article here
6 July 2020: The Dow Jones ended the day, 6 July 2020 up by 1.78%
Dow Jones Updates:
Website updates:
We looked at the performance of the major US stock market indices over the last 10 years. Below a short extract from that article
The summary below shows the returns of the major US stock market indices (Sorted from best to worst performer)
Read the full article here
Dow Jones Updates:
- (12;03): The Dow Jones is currently trading up by 0.87%. A pretty positive day for the Dow
- (08:00 ET): Dow Jones futures are currently trading down by -0.48%.
- (1:41 ET): Dow Jones futures are currently trading down by -0.70%. Signaling that markets will probably open on a relatively negative note
Website Updates:
We covered the latest earnings report from Helen of Troy, owner of brands such as OXO, Braun and Hydro Flask
So what is Helen of Troy's stock worth based on the release of their latest earnings report? Based on the group's latest earnings and their outlook provided our valuation model provides a target (full value) price at $174.10 a Helen of Troy stock. We therefore believe that the stock of Helen of Troy is overvalued.
We usually suggest long term fundamental or value investors look to enter into a stock at least 10% below our target (full value) price which in this case is $174.10. Thus we see a good entry point into Helen of Troy's stock at $156.70 or below. We believe that Helen of Troy's stock will pull back in coming weeks and months to levels closer to our target price (full value price).
Since the stock of Helen of Troy (HELE) is trading at well above our suggested entry point we rate the stock of HELE as a sell
Read the full article here
9 July 2020: The Dow Jones ended the 9th of July down by -1.39%
Dow Jones Updates:
- (14:25 ET): The Dow Jones is currently trading down by -1.22%
- (9:51 ET): The Dow Jones is currently trading down by -0.52%
- (7:44 ET): Dow Jones futures are currently trading lower by -0.12%
- (4:51 ET): Dow Jones futures are currently trading down by -0.14%. Signaling that markets will probably open on a slightly negative note
Website Updates:
We covered the latest earnings report of Urban Outfitters. A clothing and apparel brand with operations in the USA and Europe
So what is Bed Bath and Beyond (NASDAQ: BBBY) stock worth based on the release of their latest earnings report? It is always hard to value a loss making company, and we either use cash generated per share as a proxy for earnings or our standard fall back position is using the stockholders equity per share as a base valuation. We therefore value Bed Bath and Beyond at $11.81 a stock. We therefore believe that the stock is undervalued.
We usually suggest long term investors look to enter a stock at least 10% below our target (full value) price which in this case is $11.81. So a good entry point into Bed Bath and Beyond's stock would be at $10.62 or below. Since the stock of Bed Bath and Beyond is trading close to our suggested entry point we rate the stock of BBBY as a Hold
Read the full article
8 July 2020:
Dow Jones Updates:
- (14:06 ET): Dow Jones is currently trading down by -0.05%
- (9:51 ET): Dow Jones is currently trading up by 0.74%
- (7:07 ET): Dow Jones futures are currently trading flat. Signaling that markets will open close to where it closed yesterday
Website Updates:
We covered the latest earnings report of Urban Outfitters. A clothing and apparel brand with operations in the USA and Europe
So what is Urban Outfitters stock worth based on their 1st quarter 2021 earnings report? Based on Urban Outfitters latest earnings report our valuation model provides a target price (full value price) for Urban Outfitters at $26.40 a stock. We therefore believe the stock of Urban Outfitters is undervalued
We usually recommend long term fundamental or value investors look to enter a stock at least 10% below our target price (full value price), which in this case is $26.40, thus a good entry point into Urban Outfitters would be at $23.80 or below.
We expect the stock of Urban Outfitters to recover from the significant drop in its stock price due to the Covid-19 pandemic as states and economies across the world starts opening up again following Covid related lockdowns and stay at home orders.
Read the full article
7 July 2020:
Dow Jones Updates: The Dow Jones ended the 6th of July down by -1.51%
- (13:34 ET): Dow Jones futures are currently down by -0.95%
- (7:58 ET): Dow Jones futures are currently down by -0.72%
- (6:25 ET): The Dow Jones futures are currently trading down by -1.00%
Website Updates:
So what is D.R Horton (NYSE:DHI) stock worth based on the release of their latest earnings report and the fiscal guidance provided for their 2020 fiscal year? Based on the earnings reported and the guidance provided our valuation model provides a target (full value) price for D.R Horton at $73.20 a stock (up slightly from our 1st quarter 2020 earnings report valuation of D.R Horton). We therefore believe that the stock is undervalued.
We usually suggest long term fundamental or value investors look to enter a stock at least 10% below our target (full value) price which in this case is $73.20. A good entry point into D.R Horton would therefore be at $65.90 or below. Since the stock of D.R Horton is trading at well below our suggested entry point into the group's stock we rate the stock of D.R Horton as a buy
Read the full article here
6 July 2020: The Dow Jones ended the day, 6 July 2020 up by 1.78%
Dow Jones Updates:
- (15:25 ET): The Dow Jones is currently trading up by 1.39%
- (8:42 ET): The Dow Jones is currently trading up by 1.24%
- (8:41 ET): The Dow Jones futures are currently up by 1.5% signaling a strong open can be expected at the start of the trading day.
- (04:01 ET): The Dow Jones futures are currently up 1.81%
Website updates:
We looked at the performance of the major US stock market indices over the last 10 years. Below a short extract from that article
The summary below shows the returns of the major US stock market indices (Sorted from best to worst performer)
- Nasdaq: 325.65%
- S&P500: 167.65%
- Dow Jones Industrial Average: 137.89%
Read the full article here
Chart of the Dow Jones Industrial Average (DJIA) vs Nasdaq vs S&P500 over last 10 years
The graphic below shows the performance of the Dow Jones Industrial Average (DJIA) index over the last month. As soon as a user clicks on the Nasdaq or S&P500 the graphic recalculates and shows the returns of the additional indices selected. The graphic will recalculate the returns if users provide their own dates, within the last 10 year (or they can select predefined dates from our Zoom box in the graphic). Data for the graphic obtained from MacroTrends.Net
Below the returns of the main market indices over the last 12 months (sorted from best performer to worst performer)
So from the above its is clear that the Nasdaq has easily outperformed other major indices such as the S&P 500 and The Dow Jones over the last 12 months. The same can be said about the 2 year performance, 3 year performance, 5 year performance and 10 year performance, as tech giants listed on the Nasdaq has been driving the performance of the Nasdaq.
- Nasdaq: 30.33%
- S&P 500: 7%
- Dow Jones (DJIA): -3.97%
So from the above its is clear that the Nasdaq has easily outperformed other major indices such as the S&P 500 and The Dow Jones over the last 12 months. The same can be said about the 2 year performance, 3 year performance, 5 year performance and 10 year performance, as tech giants listed on the Nasdaq has been driving the performance of the Nasdaq.